Anyone reading the title of our article will believe that we spent the last week in a cave or without an internet connection. Nothing is further from the truth, though. We have been following all events closely. The point is that we do not believe in the ‘power of the event’ but rather in the ‘message of the chart’.
What our charts are telling is currently is quite unbelievable: the stock market is about to start a big rally. That is not what WE are saying, that is what stock market internals are saying, and we simply read this message in the charts.
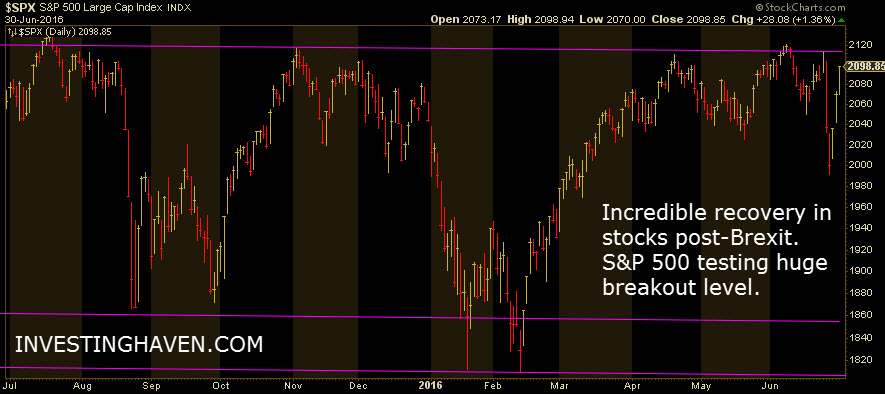
The S&P 500 daily chart does not reveal that message. As the first chart shows, the S&P 500 arrived at huge resistance, yet another time, so we cannot conclude anything at this point. We have to wait and see whether the index will be able to clear 2,100 points, after so many unsuccessful attempts over the last year and a half.
However, our belief in a strong rally to all-time highs is based on market internals (market breadth). We have two charts that serious investors should not and cannot deny.
2 Stock Market Internals Extremely Bullish
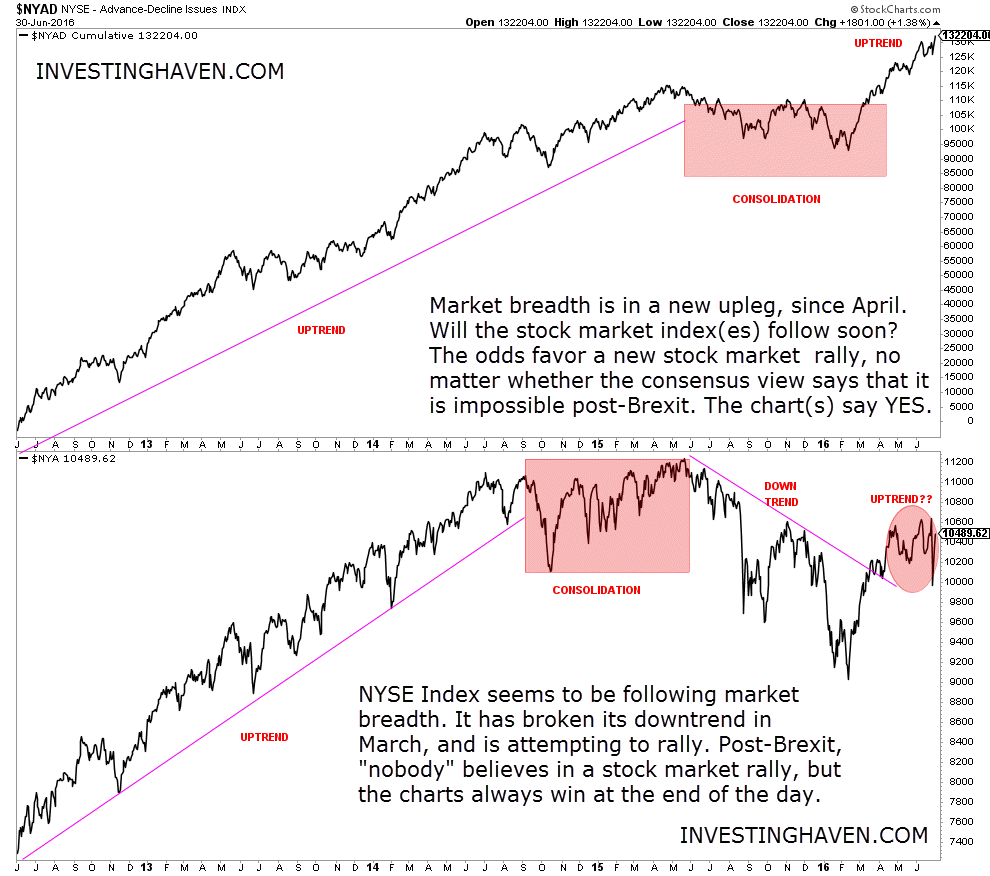
First, the NYSE advance minus decline issues since 2012 signaled a strong stock market rally already back in April of 2016. The upper pane of the following chart makes that point. It really does not matter what event is taking place, Brexit or not, the stock market trend started 3 months ago, and a Brexit is not able to stop such a trend, simple as that.
Please do not shoot the messenger in case you read this article with disbelief. It is the chart that is giving us this message, it is not our belief nor our opinion.
There is even more evidence of a coming stock market rally. The next chart, courtesy of Sentimentrader, goes even back 60 years! It also shows market internals. Wednesday was a day with 90% Up Volume. The last time NYSE volume was so heavily focused on advancing stocks on consecutive days was in January 2013 and there haven’t been many occurrences besides that. All of them were bullish for the medium-term. Even if we relax the parameters, medium-term returns in the S&P 500 going forward were exceptional.
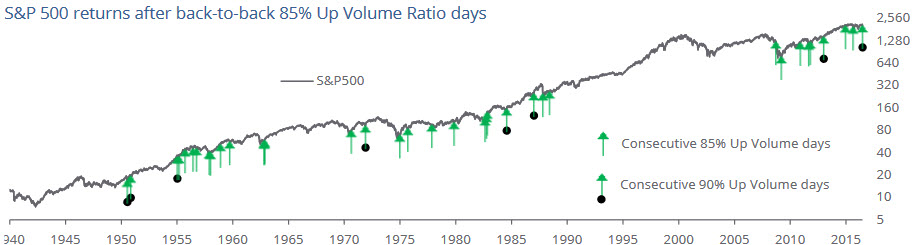
The last time we had big back-to-back gains following big back-to-back losses was 2011. Going back further, such reversals tended to lead to modest upside in the medium-term but not so much shorter-term. The S&P had a strong tendency to give back some of the gains in the weeks ahead.
CONCLUSION: The message of the chart is clear: massively bullish market internals suggest a stock market rally is coming, which will catapult U.S. indexes to all-time highs. Whether that rally starts in 1, 5 or 10 weeks is not clear. The point is that a new trend is brewing, and serious investors better do not ignore this type of convincingly bullish message from stock market internals.


