At InvestingHaven we believe that commodities may do well in 2018. Our commodities forecast for 2018 is bullish because of the intermarket correlations between the commodities complex and the USD. However, there may be one scenario in which our commodities forecast 2018 may be bearish. This article details our vision.
Medium term commodities forecast 2018
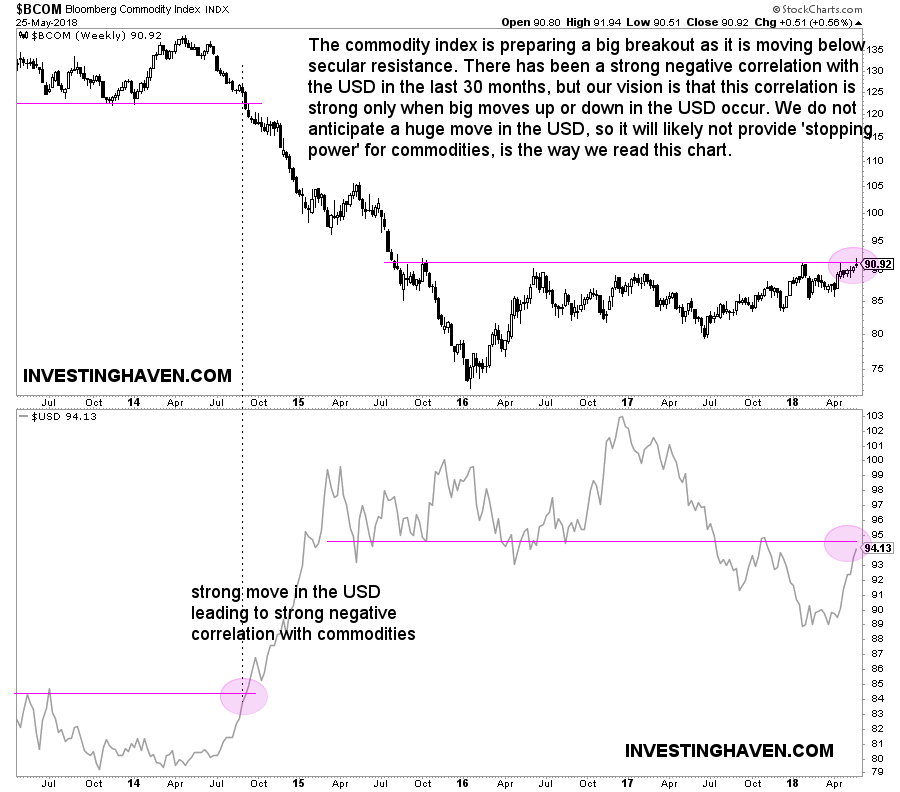
When we look at the 5-year of both the USD and the Bloomberg commodities index BCOM we get the first chart embedded below.
What’s interesting about this chart is two things. First, commodities have been building up momentum in the last 24 months, with a quadruple top at 91 points in the BCOM index. This type of pattern mostly has a bullish outcome. Second, the USD is hitting resistance on its weekly chart.
The USD has a negative correlation with commodities in general. However, it is important to note that, especially in times when the USD is trending very strongly, it tends to have strong intermarket effects (ripple effects) on other markets, first and foremost commodities.
So the million dollar question is how strong we believe the USD will rise from here, given its 5 percent rise in recent weeks.
If we look at the combined USD/commodities chart we tend to believe that the USD may likely rise but not as strong to create the ripple effects we mentioned before. A continuation in the 90 to 100 points range seems most likely at this point.
The odds favor commodities to be mildly to extremely bullish in 2018. These are the Top 3 Commodities To Watch In 2018
However, never exclude the flipside of anyone’s forecast, including ours, to come true. A strong rise of the USD above 100 points would invalidate our commodities forecast. And the long term charts signal that we cannot be very certain at this point, so there are conditions and different outcomes on the long term charts to take into account before blindly taking positions based on the first chart.
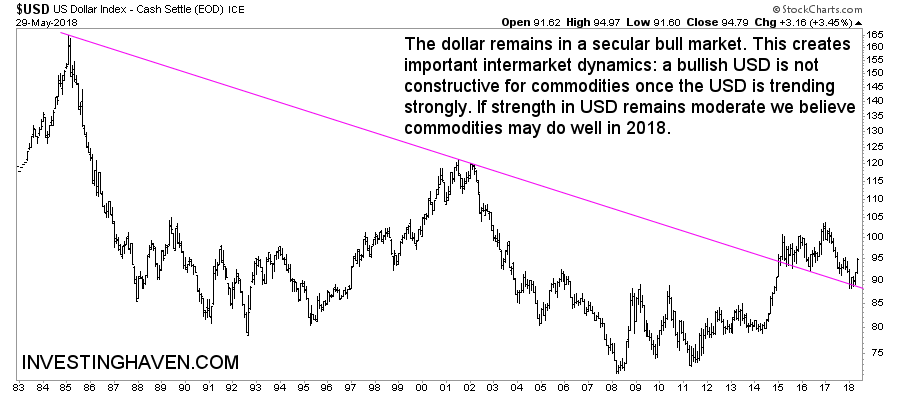
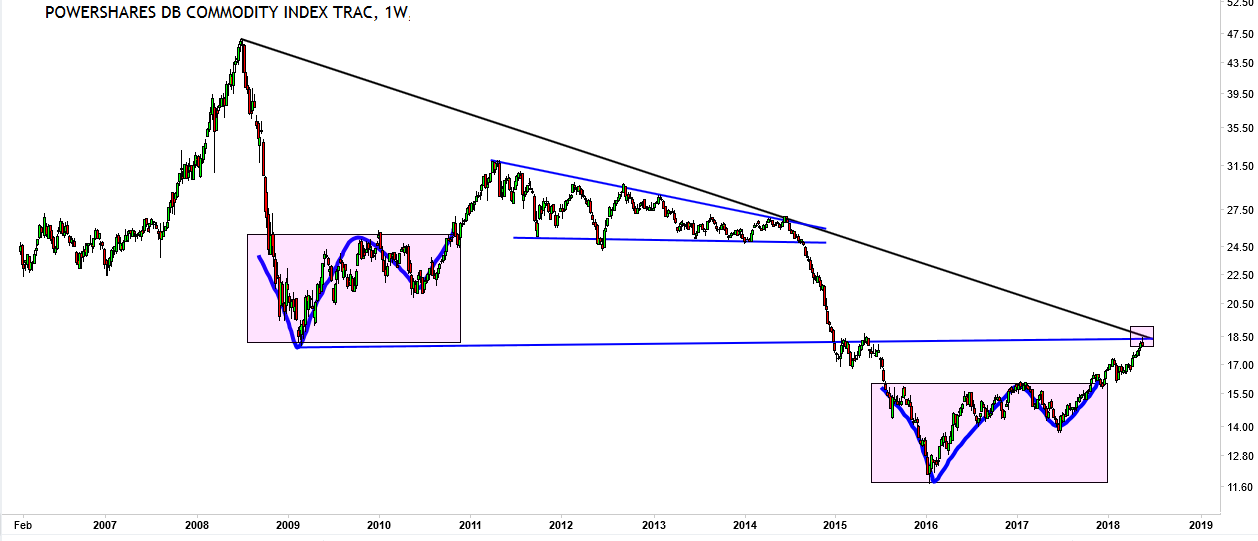
Long term commodities chart
The above commodities forecast for 2018 is valid on the short to medium term. It is key to check the secular charts, always, for a long term forecast.
Interestingly, the commodities index on the 12-year timeframe shows a strong bottom which was set between 2015 and 2017. In 2018, there is a clear breakout, which is bullish, but commodities are hitting mega resistance. That’s happening exactly at a time when the USD successfully tested secular support, see the third chart in this article.
What to make out of the 2 long term charts: secular USD + secular commodities charts? There are essentially 3 scenarios for the longer term, which is 2019 and 2020, and they are quite extreme:
- Scenario 1: both assets consolidate for a while around current prices, before any of them makes a major move.
- Scenario 2: commodities break out which is likely to happen if and when the USD is mildly to wildly bearish. This scenario will materialize once the USD consolidates below 100 points and/or goes below 88 points structurally (which means for at least 4 consecutive weeks).
- Scenario 3: the USD rises strongly, commodities are neutral to mildly bearish. Note that we do not expect commodities to be very bearish in case the USD
Is there a fourth scenario, in which both the commodities and the USD go up? That is not very likely, at least not both being wildly bullish simultaneously. We would be very surprised if both would go up strongly at the same time.
Looking at both the medium term and long term charts, we tend to believe that commodities may very bullish in 2018 but only if they go structurally higher from here which means that they trade for at least 4 consecutive weeks above current price levels. If not, a consolidation seems the next likely scenario.
If the USD remains very bullish it likely can crush the commodities complex though we don’t see it happening at this point in time. Yet, any scenario is possible in markets, and we recommend readers to check both charts closely in the coming weeks and months in order to identify the next trend in both assets!