We are constantly on the lookout to discover leading messages within the complex of markets. One of the leading indicators is copper. It is mostly indicating the health of the economy, hence its alias “Dr. Copper” or “economic health barometer”.
Dr. Copper is creating a very clear and powerful pattern on its chart. We love that, because of its simplicity and directness.
Investors should not underestimate the power of this chart pattern. As seen on the chart, this pattern is about to resolve, either to the upside or the downside. Whatever the direction, it will be a powerful move.
We do not see many indicators which could forecast the direction of copper’s upcoming move. What we do know, however, is that copper tends to move extremely sharp (not visible on below chart, though, but clearly visible on a secular chart over the last 4 decades), and that there is some room to the downside until the $1.70 area connecting the highs of 1980 and 1990 (not visible on the chart neither).
What is highly unusual is that copper is forming a 6-month base which, visibly, has not happened before. A base formation usually signals strength, so we could consider this a slightly bullish element.
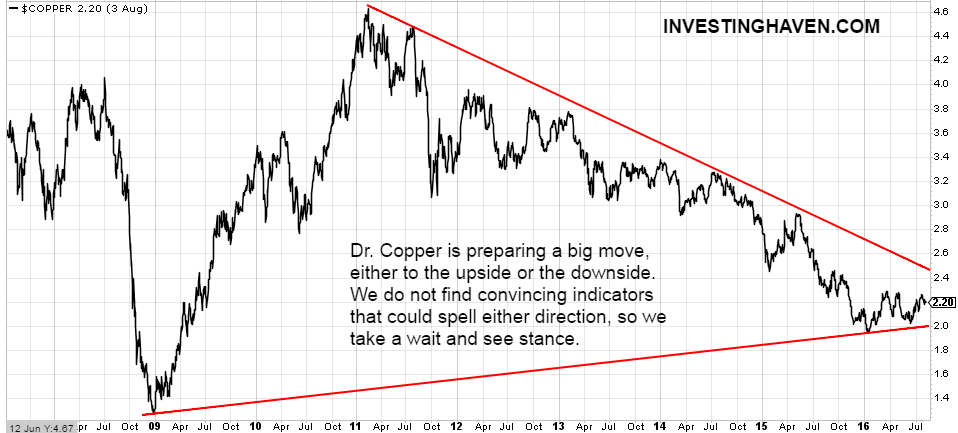
Copper’s price should be monitored closely with important price points being $2.0 on the downside and $2.5 on the upside.


