We have discussed at length different forecasts for 2017. All our calls, so far, seem to be spot-on. Think of our bullish call for financial stocks in 2017 and bearish gold price forecast 2017. In this article we explain our broad markets outlook for 2017.
Many investors look for leading indicators. Some look at the volatility index (VIX), others at the U.S. dollar or inflation expectations (TIPS). Some believe that reading the news will be helpful to understand where markets are going. The truth of the matter is that none of all that is helpful whatsoever. Most sources are only noise, and that is the reason why only 10% of investors are successful.
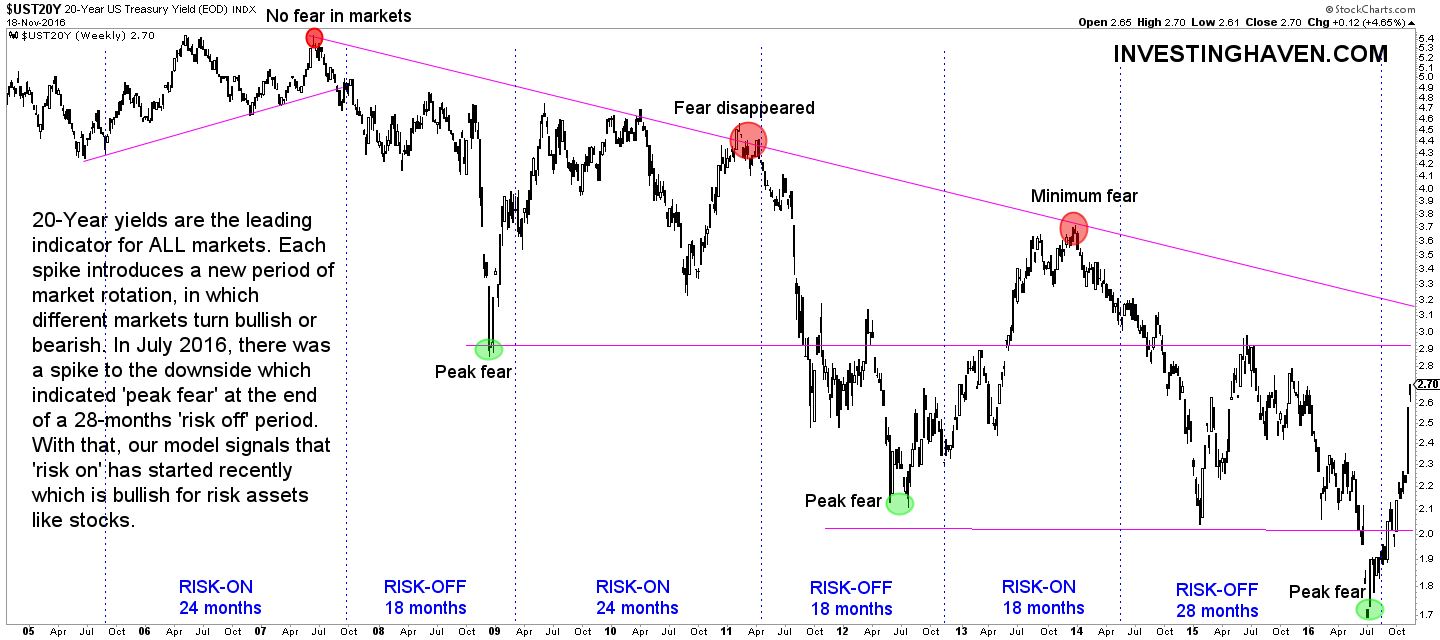
The leading indicator of all markets is the 20-year treasury yield, but you have to understand how exactly to ‘interpret’ it. In order to help investors understand why and how 20-year treasury yields are so important, we annotated its chart. It all comes down to intermarket dynamics: the 20-year treasury yield influences how other markets are moving, and that is the basic principle of how markets work.
As seen on the first chart, the long term chart of 20-year treasury yields, the key step is to identify multi-year peaks and bottoms. They indicate that risk sentiment is peaking. With peak fear, for instance after the Brexit this year, most investors threw in the towel. As a consequence, everyone was selling risk assets. If that comes after a 18 to 24 month period of time of ‘risk off’ sentiment, it mostly points to exhaustion. And, as we all know, that is the basis for a turnaround.
The Brexit is actually a very good example. ‘Everyone and his uncle’ was convinced that it was bad for stocks and good for gold. While that certainly makes sense from an investment perspective, it came after a period of 28-months of fear (risk off). The Brexit was the proverbial cherish on the cake. With the Brexit, fear among investors reached a peak, and, with that, selling of risk assets peaked as well (read: got exhausted). That is how markets work: it is all about context and intermarket dynamics.
Broad markets outlook for 2017
With the insights provided on the chart of 20-year treasury yields, and how it is a leading indicator for markets, we examine its meaning for the 2017 broad markets outlook. After July 2016, yields exploded, suggesting the return of ‘risk on’. Simultaneously, U.S. stock markets went higher, they even broke out to all-time highs.
The leading stock market index is the Russell 2000, it has a very important meaning in global markets, and is mostly a leading stock index (compard to the Dow Jones, S&P 500 and Nasdaq).
As the Russell 2000 is breaking out now, right at a time when fear assets like gold and the Yen are selling off, we believe it is the ultimate signal that risk is returning. Our markets outlook for 2017 is bullish for U.S. stocks.
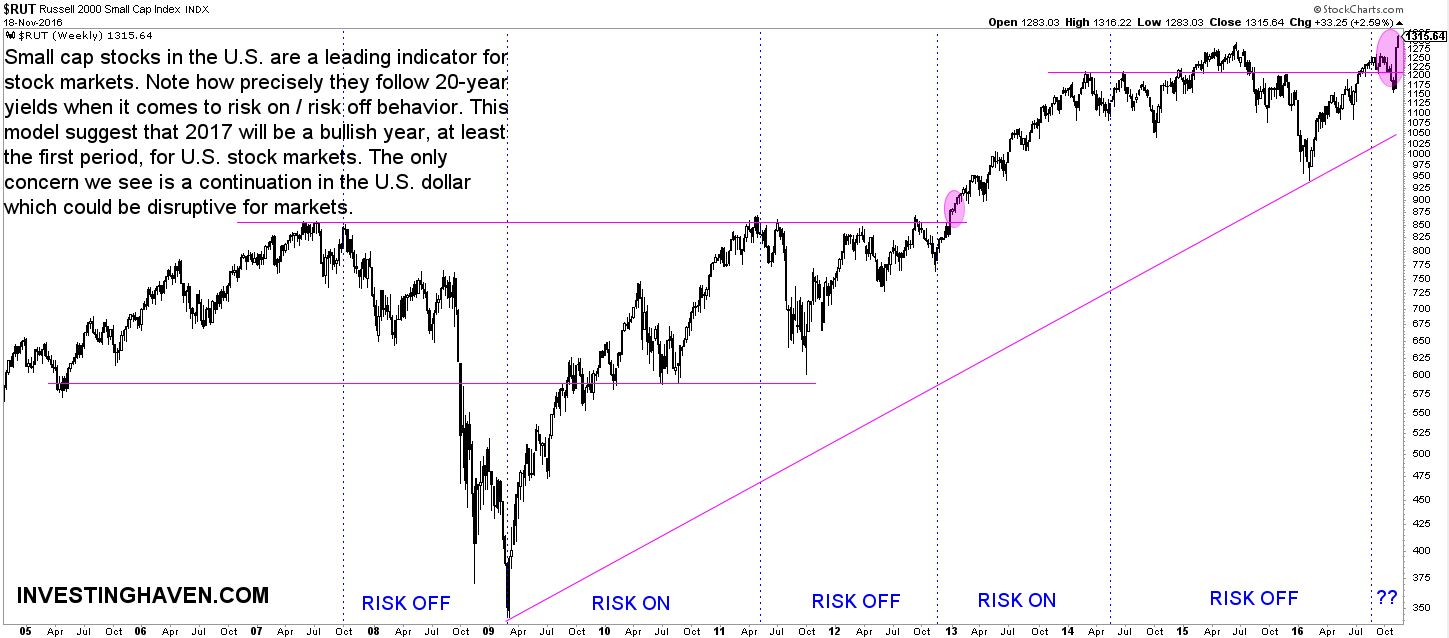
One potential concern will the U.S. dollar, as explained in our emerging markets forecast. Continued strength in the U.S. dollar could invalidate our bullish market outlook. We are closely monitoring what the U.S. dollar will be doing in the coming weeks and months, and update readers as required.
This article originally appeared on Investing Haven


