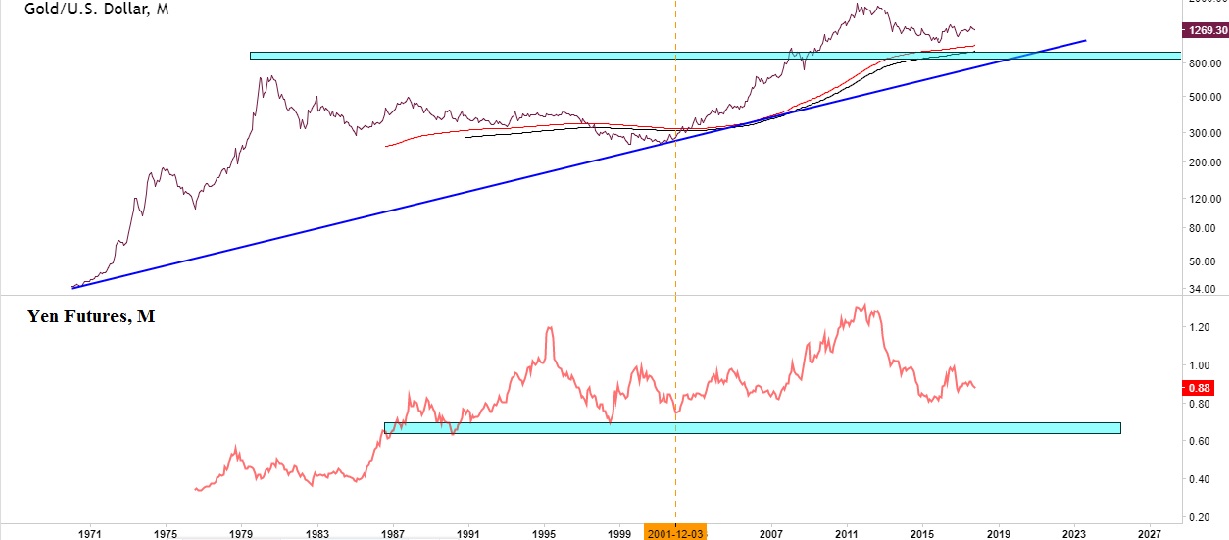
Gold and the Japanese Yen are widely accepted as safe havens. Given recent turmoil in the geopolitical landscape, with major events occurring like the threat of a nuclear war, Brexit and a European split up, and the likes, the question is why safe havens are not reacting stronger. Moreover, what can we expect from these safe havens in the coming years, and what is our safe havens forecast for 2018?
Before looking into a safe haven forecast for 2018 and later, let us first consider the psychological market effect of gold specifically.
Gold’s price most often reacts to comfort the psychology of investors every time “bad news” hits the wires. That is when gold shows a spike on its chart
This goes back to August 1971 when US president Richard Nixon took the dollar off the gold standard. The gold standard had been in place since the Bretton Woods Agreement of 1944, and fixed the conversion rate for one Troy ounce of gold at $35.
When it comes to gold’s precise role in the financial system, and its fundamental value (as opposed to its market price), we recommend investors do not get distracted too much on the underyling “why” question because that is a topic for fundamentalists. We are not saying it is an unimportant topic, we do say that the primary focus of investors should be gold’s chart.
Forecasting safe havens: 2018 and beyond
The chart below shows the correlation between gold and the Japanese Jen. Gold’s chart (log scale) shows that the price of gold is in a long term uptrend as evidenced by the long term trendline (dark blue).
Since the end of 2001 both gold and the Yen started to move in tandem. Why exactly did that happen? That is a very good question, but how valuable is it to resarch the answer? Our belief is that investors should not focus too much on the “why” question but much more on the “how” question. The “why” question can be analyzed by fundamentalists.
The current correlation between gold and the Yen started right after the 2007 global financial crisis which triggered the last leg up of commodities bull market. After most commodities topped in August 2011, both gold and the Yen have moved in a downward and sideways pattern.
With that, is it possible to determine where safe havens gold and the Yen go from here?
Forecasting is not an exact science. However, we feel that it is definitely helpful to use major support or resistance levels on monthly charts (which we consider a “bird’s eye view”) to establish scenarios with probabilities of future price movements. This implies we certainly do not pretend to be able to forecast short term price movements (less than a month).
Given the current chart setup we believe it can take at least 3 to 5 years for gold to settle around 900 to 1000 USD (the light blue bar). As long as the current correlation is in tact we see a similar move in the Yen.
In other words the scenario with the highest probability is a continuation of sideways pattern with downward bias in both safe havens.
Until gold’s price has come close to the light blue bar and/or the rising trendline we recommend investors to sit back, relax and let the market do its work … without losing too much time reading unhelpful articles on financial media.


