During volatiles time we often seek safety because it makes us feel comfortable. When stock markets are not doing well or during economic downturns investors look for one safest havens: Government bonds.
A Treasury bond (T-bond) is a fixed-interest U.S. government debt security with a maturity of more than 10 years. Treasury bonds make interest payments semi-annually, and the income received is only taxed at the federal level. Treasury bonds are known in the market as the lowest risk investment; they are issued by the U.S. government with very little chance of default. Besides, there are also a handful of corporate and municipal bonds for investors to grab too.
Treasury bonds (T-bonds) are one of four types of debt issued by the U.S. Department of the Treasury to finance the government’s spending activities. The four types of debts are Treasury bills, Treasury notes, Treasury bonds and Treasury Inflation-Protected Securities (TIPS). Each of them vary by maturity and coupon payments. All of them are considered benchmarks to their comparable fixed-income categories since they are virtually risk-free, backed by the U.S. government, which can raise taxes and increase revenue to ensure full payments. These investments are also considered benchmarks in their respective fixed-income categories as they offer a base risk-free rate of investment with the categories’ lowest return.
Many fund managers or financial advisors also suggest to include these bond as a key component of a balanced investment portfolio
Stock markets went through a serious roller coaster ride since Feb 2018. InvestingHaven’ research team will take this opportunity to analyse various bond charts, for educational purpose.
The weekly chart of Treasury bond futures (30yrs maturity) fits nicely in an primary uptrend channel. However, it seems that price has broken below the “head and shoulders” neckline. We interpret it as a mid-term bearish for next 1-2 years with an ultimate target of around 128 which coincides with the lower channel support. However, if price breaks back above the pink neckline, we would change our stance accordingly.
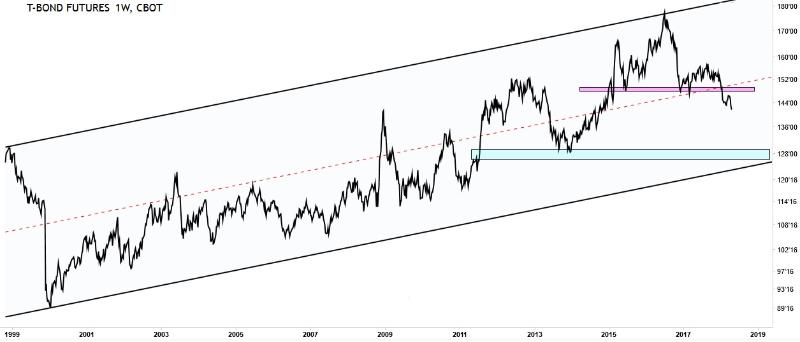
Treasury Bond futures weekly chart
Our team went one step further to compare the above weekly 30yrs bond futures chart with S&P500 weekly chart.
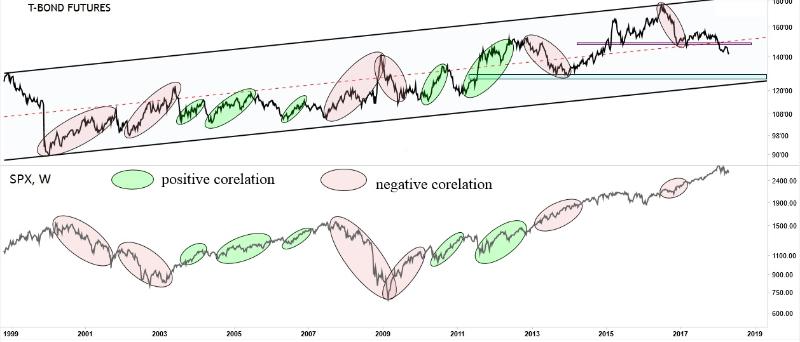
30yr Treasury bond futures vs SPX
Generally as can be seen from the comparison chart above, when Bond is generally going down SPX is generally going up and vice versa especially during the cycles highlighted in pink. That means when investors are in a ‘risk off’ mode they prefer to park more capital on bond than stock market. Those areas highlighted in green refer to periods in which stock markets and bonds are in sync, moving up and down together. For the latest period since 1st Feb, bond and SPX went down together. And if this carries on, it literally means that investors have one safe haven less to invest in during the stock market downturn.
iShares 20+ Year Treasury Bond ETF (TLT) is an ETF that seeks to track the investment results of an index composed of U.S. Treasury bonds with remaining maturities greater than twenty years.
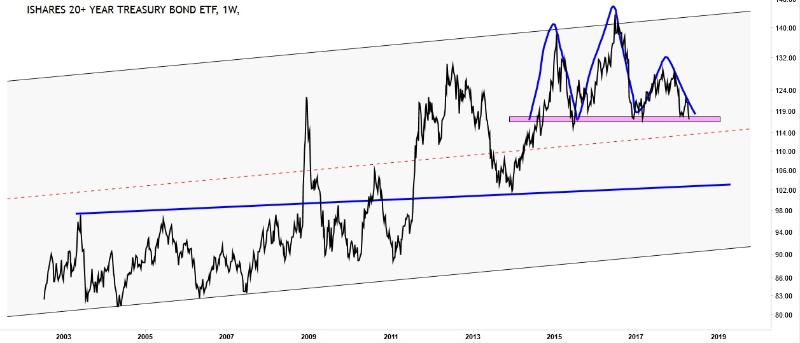
Weekly TLT chart
Price is in primary bull trend with a very wide channel. However, there is a massive 4 yrs head and shoulders topping formation that seems to be completed now. Price is currently wiggling at the pink neckline. Should price breaks this support, we will be mid-term bearish for TLT. First immediate target around 114 and should this fail, 103 will be the next downside target. That said we will also consider the possibility of price reversing which mean we will turn bullish.
iShares 7-10 Year Treasury Bond ETF (IEF) has broken below the head and shoulders neckline, the two respective downside targets are 99 and 95
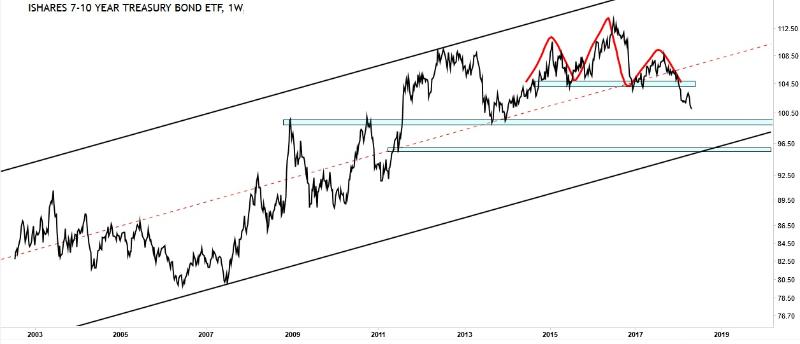
iShares 7-10 Year Treasury Bond ETF (IEF)
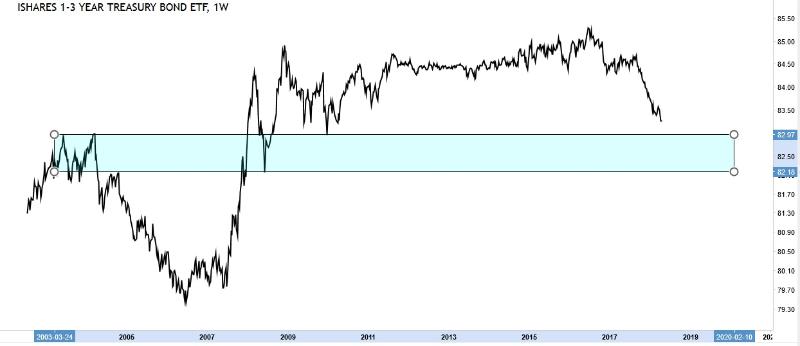
Even the short term – iShares 1-3 Year Treasury Bond ETF (SHY) does not look promising as an investment at least for short term. We expect the zone of 82.18 – 82.97 to be a crucial support zone and huge amount of volatility if price does reach this zone in next 1-3 year’s time.
With all the short to long term bonds futures and ETFs give bearish sign, what are the bond markets trying to convey? We can only draw conclusions as in what this means for bond as well as broader markets, but for investing purposes we recommend to take advise from you financial advisors for their expertise.


