Uranium Energy Corp, symbol UEC (UEC), is consolidating for 3 months now. This has never happened before in the last 24 months. Knowing that UEC is one our top favorite uranium mining stock play we try to answer the question whether UEC is an uranium stock to buy or sell now or later in 2018.
Note that UEC looked strongly bullish at the end of last year when we wrote Uranium Energy Corp (UEC) Stock Price Looks Explosive Going Into 2018. Based on below analysis we still believe that the returns may be very interesting. However, in sum, the next 4 to 6 weeks will become crucial as a new trend, either up or down, will emerge!
Buy or sell UEC now?
First, very important, the spot price of uranium looks bullish. As seen here uranium’s spot price is on the rise in recent months. If this continues it will be a catalyst to the whole sector, and uranium miners will double and triple in just a few months.
However, it is extremely hard to forecast the uranium price as it is such a complicated and closed market, so we are deliberately not going to even do an attempt.
Second, UEC is a leveraged play on the uranium market. We have explained in detail why we believe UEC is our favorite uranium mining stock in this article published more than a year ago.
UEC’s daily chart shows two trading ranges: one that started in January of 2017 and continues until today included (see purple bars on below chart), the other one is a more narrow and shorter consolidation of 3-months in the $1.45 to $1.80 range (see white circle on below chart).
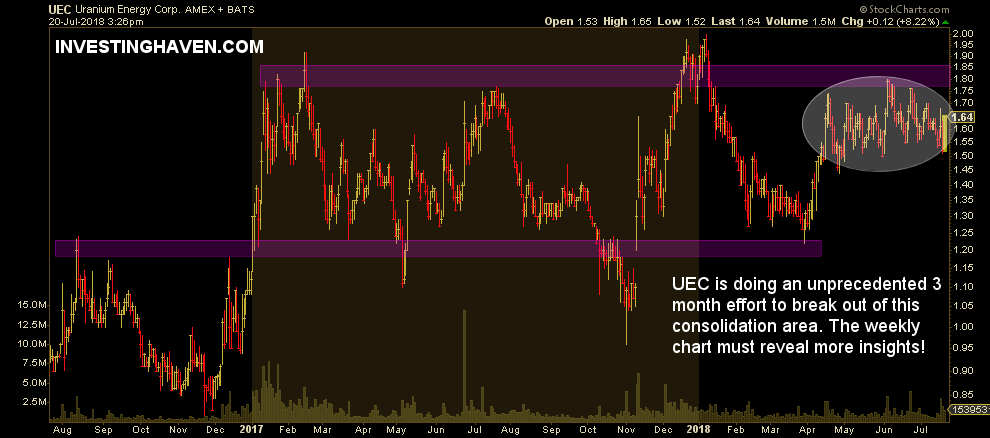
Essentially, the daily chart does not provide an answer to the question wheter UEC is an uranium stock to buy or sell now right away unless this stock crosses $1.80 convincingly (which is just 10 pct above current price levels)! That’s why we have to zoom out and check the longer timeframe: the weekly chart.
Buy or sell UEC in 2018?
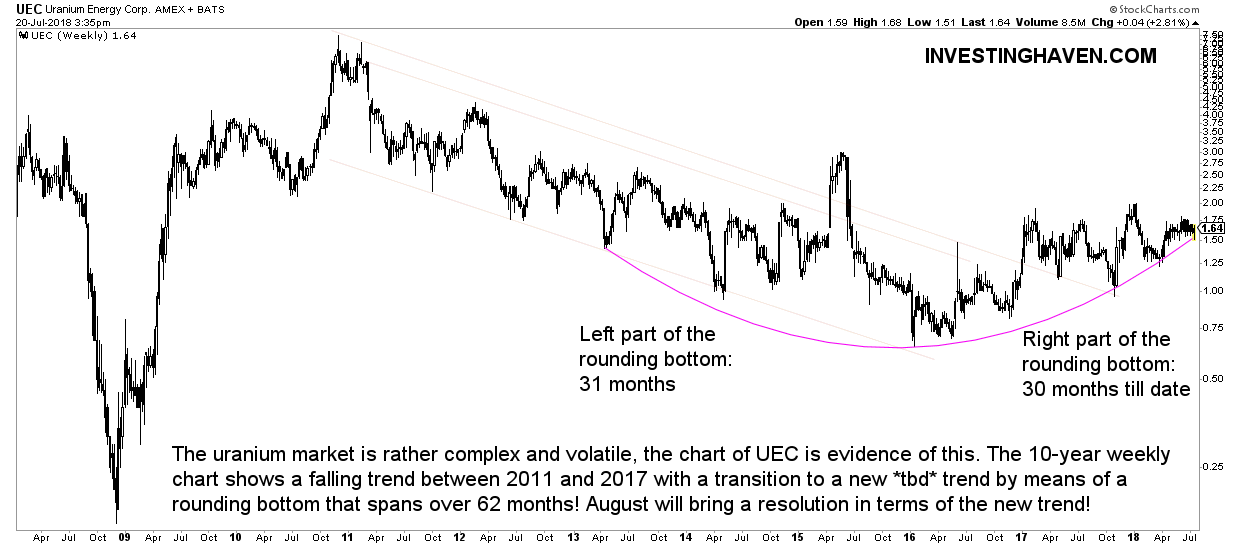
The weekly chart on 10 years shows two very interesting patterns which may provide an answer whether this is a buy or sell in 2018 and beyond.
First, the falling trend which started in 2011 got broken as 2018 started. Essentially, the long term chart says UEC is in the process of becoming bullish.
Second, there is a mega rounding bottom which spans over 61 months now. The most interesting piece here is that we are at decision time. The left part of the rounding bottom took 31 months to complete. As the right part is now at the 30th month it should reveal a new trend next month (although in reality rounding bottoms are certainly not always perfectly symmetric).
Which direction will this go? Very hard to say other than this: if UEC’s price goes below $1.50 for 3 consecutive weeks it breaks down from the rounding bottom and will become bearish.
So if we combine the insights from the daily chart with the one(s) from the weekly chart we conclude this: above $1.80 it may become wildly bullish, below $1.50 very bearish, and August/September will be decision time!