Is gold (GOLD) bullish or bearish? Is the US dollar bullish or bearish?
We receive this question almost daily from our readers. Seems like it is time for another update on gold and the dollar.
The underlying reason that investors are so interested in both gold and the dollar is because of their perceived inverse correlation. We say ‘perceived’ because their inverse correlation only applies over the very long term, as explained in detail in How To Read The U.S. Dollar Chart And What It Means For Gold Investors. Shorter term, however, both assets are not strongly correlated.
Both gold and the US dollar about to start a new bullish or bearish trend
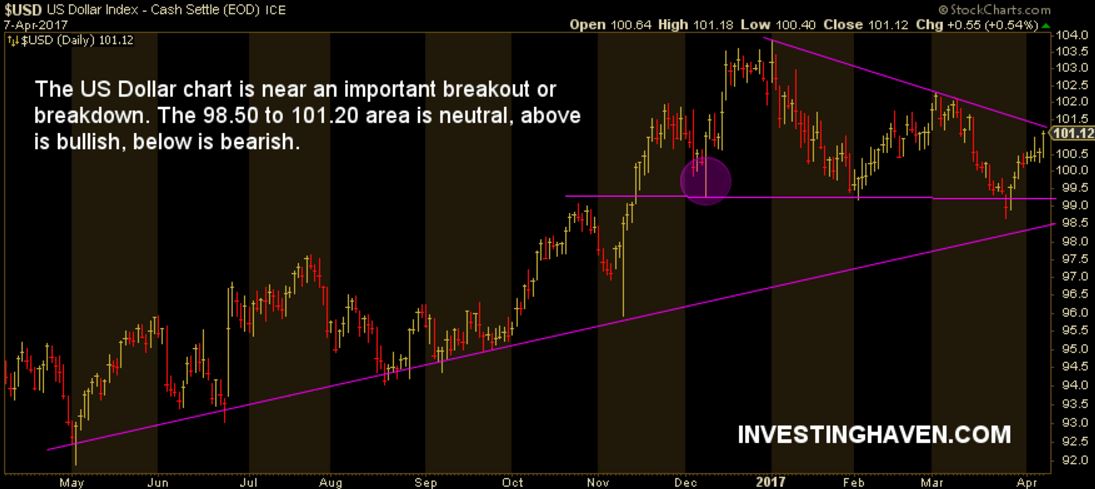
First, let’s review the US dollar. The long term outlook of the dollar is bullish at this point. We explained the bullish case for the dollar based on the long term US dollar chart. On top of that, we added in our US dollar forecast for 2017 that the 101 level was the line in the sand: once the dollar breaks for at least 3 consecutive weeks above 101 points, it becomes very bullish.
So far the long term USD chart.
On the shorter timeframe, the USD basically confirms the observations and conclusions from the long term chart. In general, that is not often case which leads us to conclude that the picture in the USD is very clear and concise (because similar on the short and long term charts).
As explained on the chart below, the dollar becomes very bullish above 101 points. Below 98.50, it is bearish on the short to medium term timeframe (secular bearish below 90 points). The chart below suggests that a new trend in the USD is near, given the triangle pattern.
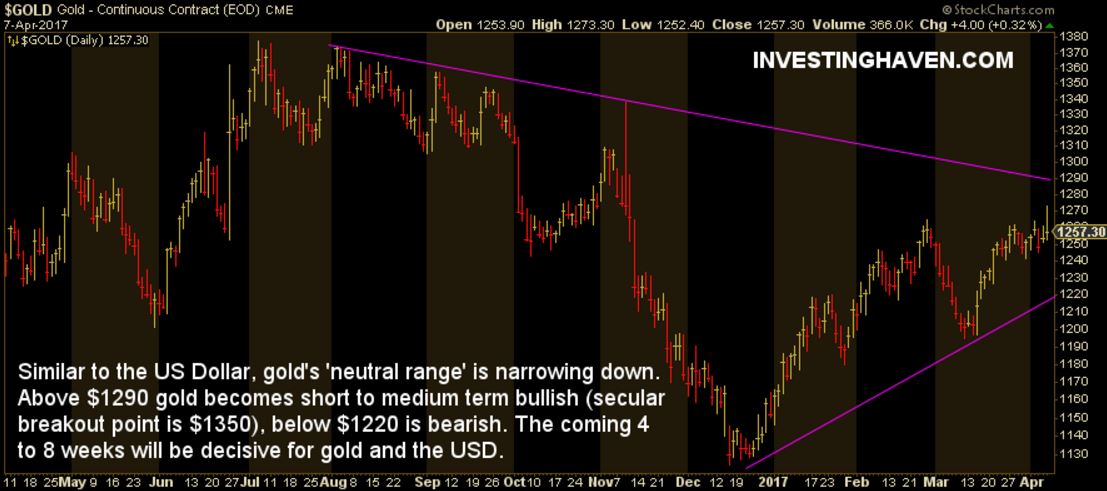
Gold is currently also in a ‘neutral’ zone, though it is also close to start a new trend. Although the triangle pattern is different than the one on the USD chart, it leads to the same conclusion.
Gold becomes bullish on the short to medium timeframe above $1290. It is bearish below $1220. As said last week, we are watching gold prices closely in April 2017 as a new trend will become clear given the aforementioned price point.
The long term gold chart suggests that gold’s bear market continues until gold breaks above $1350. That is in line with our gold price forecast for 2017.