How to read gold’s price chart? That is an interesting topic which is subject to a lot of controversy. That is because gold is driven by a multitude of factors. Looking carefully at gold’s chart, there are quite some insights to derive. We look at 10 key insights from gold’s long term price chart, which are important enough for every gold investor.
The controversy mentioned above is visible in the news headlines. In the last couple of days, we see how this analyst combines trendlines and Fibonacci on gold’s price chart, this analyst looks at inflation and stock market data as a driver for gold’s price (intermarket analysis in other words), and similar intermarket data are used in this gold price discussion.
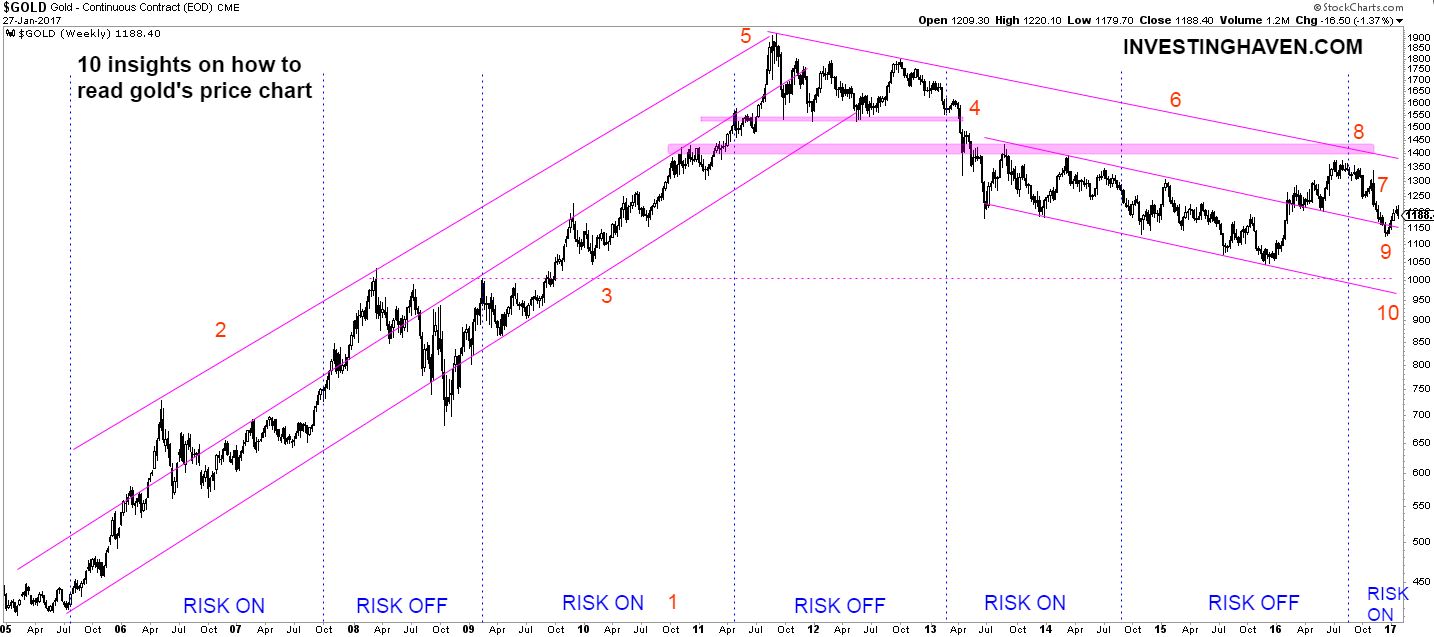
Interestingly, InvestingHaven’s research team says that “gold is driven by all of these factors but, even more importantly, it is contextual”. That makes for a complex cocktail of factors. Gold’s long term price chart (see below) makes that point.
Point 1 refers to the risk on / risk off market cycles, in line with the primary market trends we discussed in Market Outlook 2017 According To Our Proprietary Indicators. Gold can move higher during ‘risk on’ market cycles. In other words, gold * can * be a fear asset, but not necessarily. Furthermore, gold can move higher driven by inflation, as seen in the 2005/2006 time period (point 2). So gold can be both a fear and an inflationary asset.
Point 3 below refers to the channel in which gold tends to move, both in a bull and bear market. Over a period of 12 years, we see only one exception (October 2008) in which it moved outside of the channel.
Point 4 indicates how important support area’s can be. In the 2011/2012 time period, gold tested at least 5 times support, after which it broke down. Support at $1550 suggested a trend change, and it is clear how important some specific price levels can be.
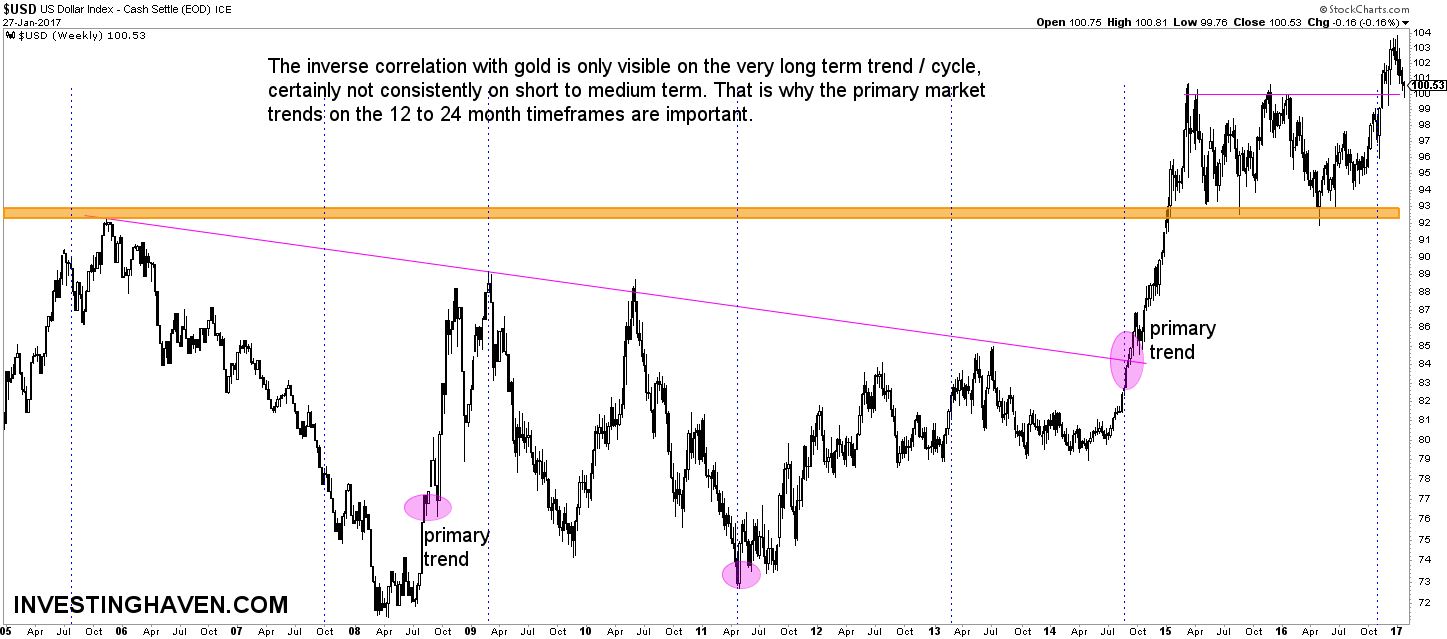
One of the most known market correlations is the inverse gold to dollar correlation. At least, that is what is said to be a correlation. On the very long term, it is indeed correct that there is an inverse relationship, as seen on point 5 on gold’s chart vs. the dollar chart below. Point 5 marks a long term top in gold and a bottom in the dollar. However, on the shorter timeframes that correlation is certainly not as outspoken, on the contrary.
Since 2012, gold is in a bear market, and the trend channel is visible since then (point 6).
Important to note, investors tend to follow the news as an indicator for the future price of gold. Nothing is further from the truth, as seen on point 7. Brexit was said to be THE confirmation for gold’s new bull market. Incorrect. Brexit took place in a bear market, and a downtrend remains a trend until proven otherwise; a Brexit is not a proof of a trend change. The more important piece of information, around the Brexit period, is that gold could not push through point 8 on the chart, which was the bull market price level. We wrote that June 2016 Is The Most Important Month Of The Decade for Gold, and our observation was quite accurate.
When it comes to the future price of gold, visibly points 9 and 10 on the chart are THE most important price levels to watch. In other words, all the other information pieces are ‘noise’ (news, dollar correlations, inflation, stock market … they are only a small part of the puzzle). If gold holds at point 9, we would see a higher low, quite an important even. However, if 9 does not hold, gold will move to 10, where, most likely, it would put a huge secular bottom.
When it comes to gold’s inverse correlation with the US dollar, that is only correct on the very long term timeframe. The long term bull vs bear market in both assets is indeed inverse, but in the long / medium / short timeframe it is definitely not a strong correlation.