The gold market started 2020 on a very strong note. However, it clearly stalled last week. One day does not make a market, and one week does not make a market neither. This implies that our gold forecast for 2020 in which we predicted a new bull market is still valid. In fact we strongly feel gold will do well but not short term. Consequently silver will follow gold’s path as said in our silver forecast. For gold enthusiasts we have 2 crucially important charts that need to be watched closely to identify when gold becomes bullish again.
Gold does never move on its own.
What makes the gold market so hard to ‘read’ is that it moves on a variety of other markets. The most challenging piece here is that those ‘other markets’ are not consistently the same. Sometimes gold reacts on the inflation expectations indicator, sometimes it reacts on the real inflation reading, sometimes on the US Dollar, etc.
Pretty fascinating for those that like a serious challenge, pretty frustrating for those that take a narrow view on reading markets.
If anything the 2 crucially important intermarket influencers we track for the gold market is the Euro chart as well as inflation expectations.
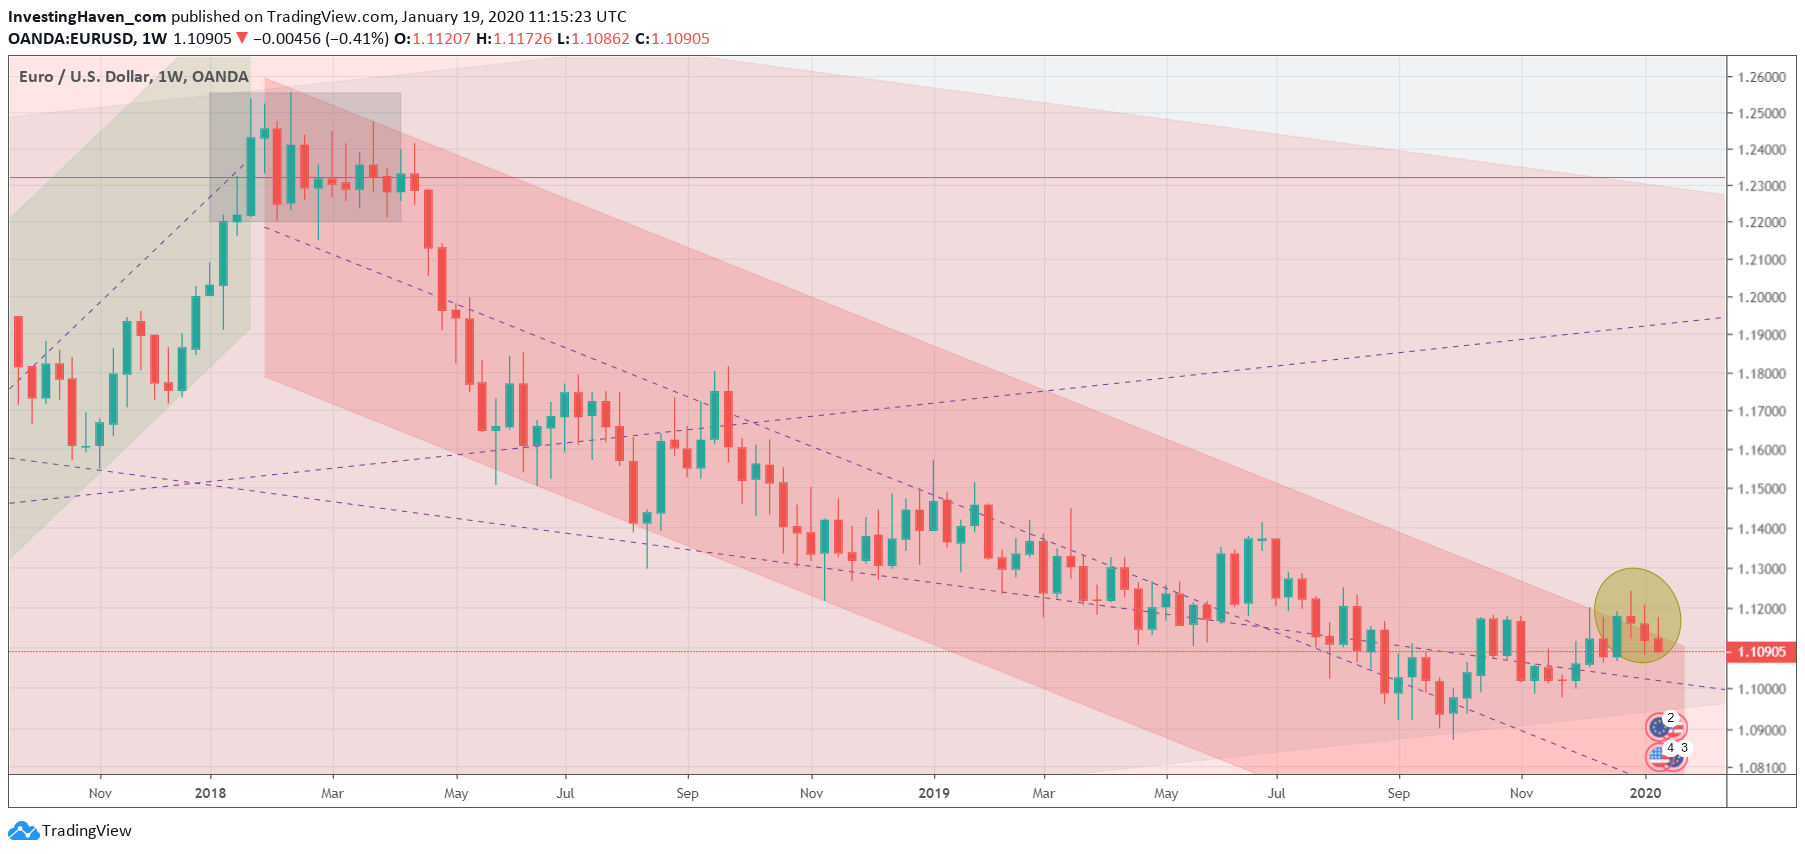
The first chart is the Euro chart we use in our premium Momentum Investing service. Yes there are many lines and colors on there, and that’s obviously on purpose. We track intermarket effects, intramarket dynamics and chart patterns on this one single chart. This article is not meant to dissect our methodology, but rather to use a snapshot to make a point about the gold market.
A few weeks ago we saw this potential Euro breakout out of a 2 year downtrend, see yellow circle. This breakout failed.
No coincidence we took a silver market position in our Momentum Investing service early on this breakout. We were early enough to exit this trade once we got the signs of the failed breakout, and we were able to close our position with a 4% profit. Great, isn’t it, to see the market turn a trend and still make money.
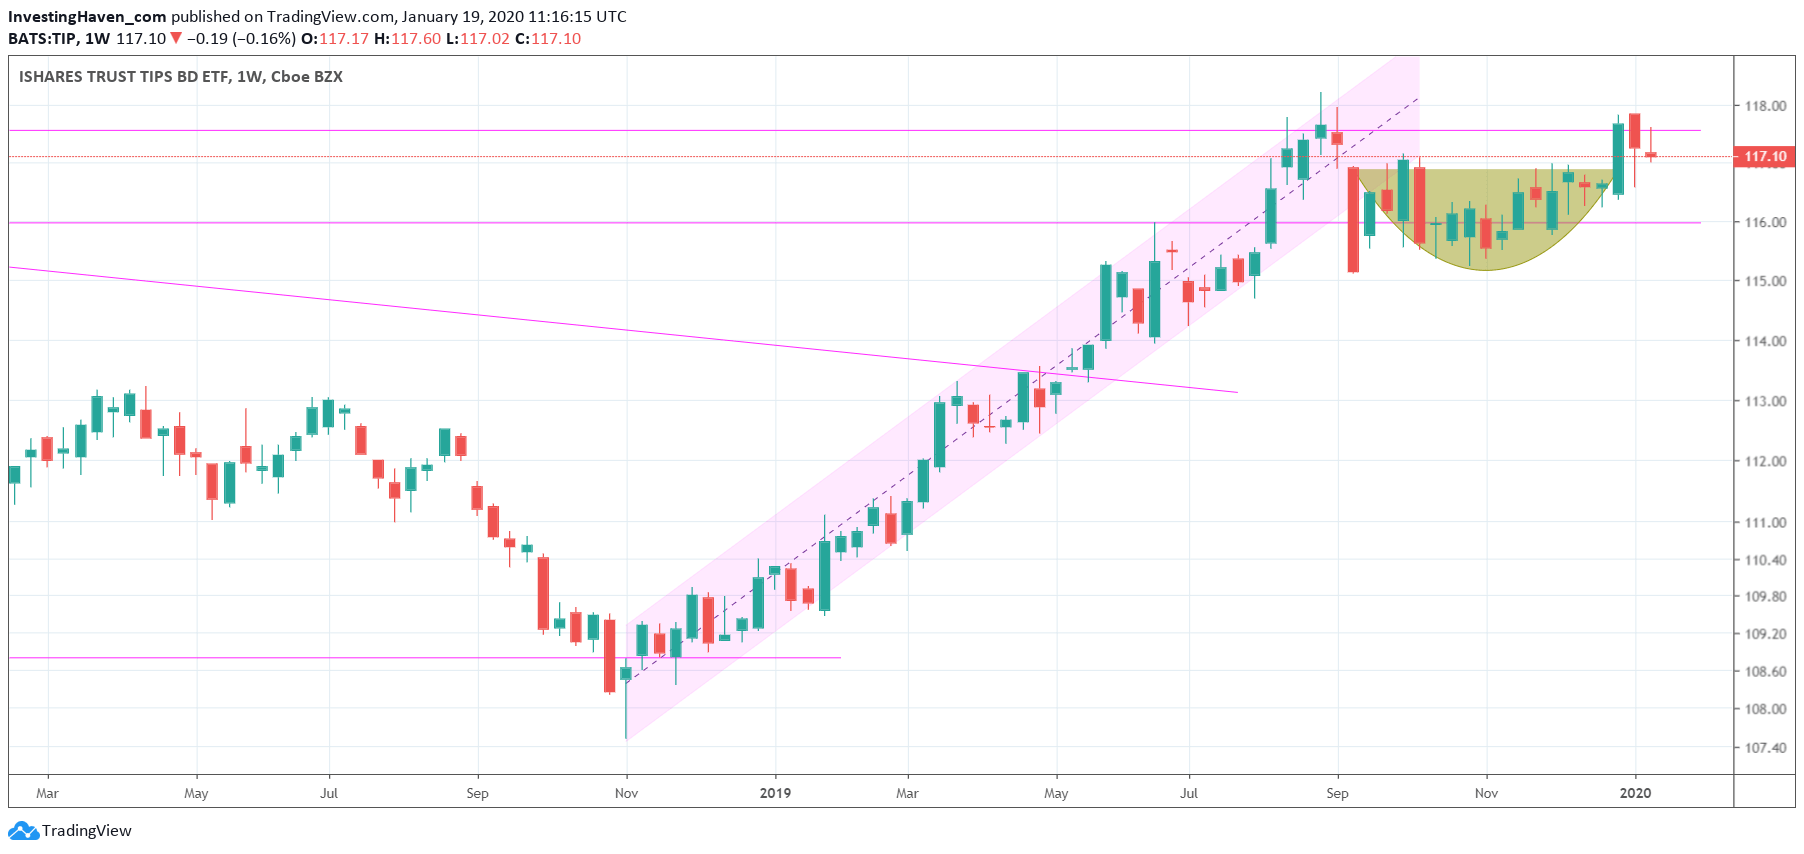
The other leading influencer is inflation expectations. In all fairness the real inflation reading is sometimes influencing the gold market as well but not as often as inflation expectations. As said reading the gold market is challenging, but we want to keep it as simple as possible in this article.
The inflation expectations ETF TIP helps us understand the state of inflation expectations.
Note that the test of its highs at 118 points got rejected (below chart), and it happened exactly the same time as the Euro failed to continue its breakout (above chart). That was for us the confirmation that the gold market needed a pause.
We still expect gold to do well in 2020 but we want to give the gold market the time it ‘requires’ to build up bullish momentum. If you want to be the first one to know when and which position to take in the gold market, way before bullish momentum is even visible to the herd, you can become a member of our ‘Momentum Investing’ premium service in which we include gold and silver positions if and when the market is ready for it.