As per our mildly bullish commodities outlook for 2020 we expect a few commodities to do very well in 2020 (source: 2020 forecasts). However, the majority of commodities will have average returns. A few select commodities will do exceptionally well in 2020. That said, crude oil looks like it wants to move higher, but after last week’s breakout attempt it looks like the time is not right … yet.
Crude’s dominant pattern is visible on the weekly chart, no need to look at the monthly.
This article features just the chart, no fundamentals nor any other data point. In the end all that matters to an investor in the commodities market is price, and only price, right.
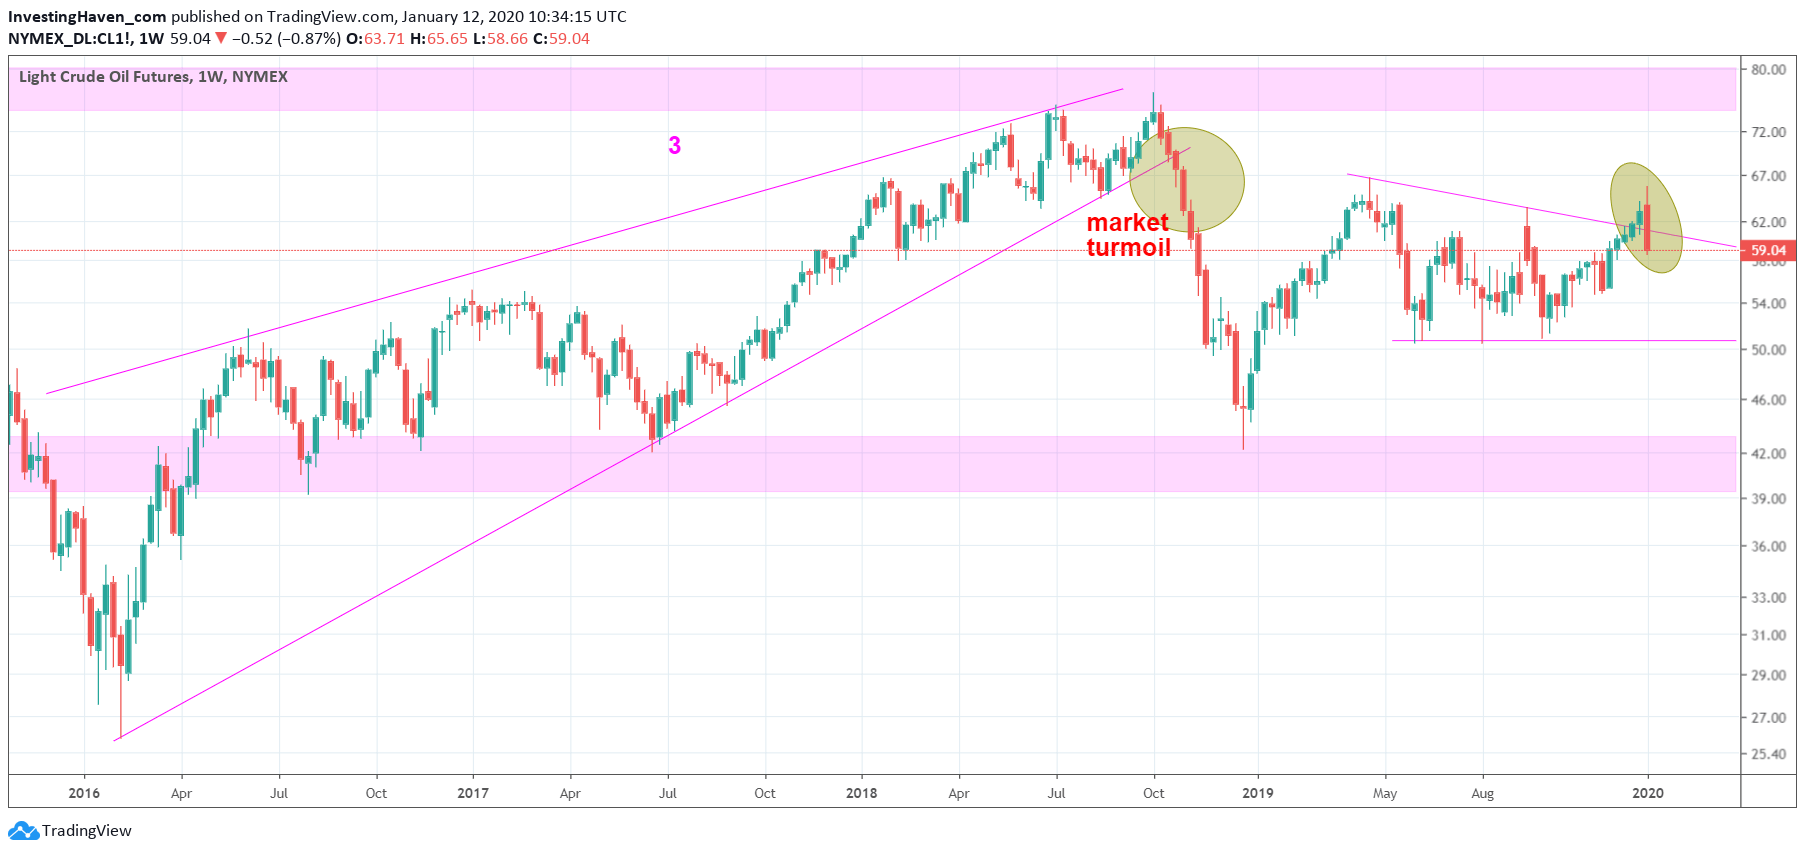
The weekly crude oil chart shows the characteristics of crude oil: a complex chart with critical horizontal readings combined with (mostly) different ‘flavors’ of triangle patterns.
This chart has one simple message: the breakout attempt from last week, probably triggered by the U.S./Iranian conflict, invalidated.
More work is required to push crude prices higher. It may or may not happen.
What to do if crude goes higher from here? Look for a new pattern that may become the dominant pattern.
Between now and then it is this descending triangle from 2019 that is dominant.
No coincidence that we did not take this trade. Our Momentum Investing methodology did not suggest from an intermarket, intramarket and chart perspective that this was the right trade for this quarter. Right call.