Some 9 months ago, when silver was hitting its 2022 lows, the consensus view was that gold & silver would start an epic crash. We said something entirely differently: One Silver Chart Justifies ‘Buy The Dip’ For Long Term Positions. Silver bottomed in that same week, the rest is history. What’s interesting is that we used the gold to silver ratio for our forecast. Where does this ratio stand today, and what does it tell us about our silver forecast and gold forecast?
In this blog post, we explore a fascinating phenomenon linked to the gold-to-silver ratio and its correlation to epic silver rallies. By analyzing historical data and observing the pattern, we uncover the potential for significant price movements in silver whenever the ratio enters the 80 to 100x range.
Understanding the Gold-to-Silver Ratio
The gold-to-silver ratio is a simple metric that compares the price of gold to that of silver. It is calculated by dividing the price of gold per ounce by the price of silver per ounce. Historically, this ratio has exhibited considerable fluctuations, influenced by various factors, including market sentiment, economic conditions, and supply and demand dynamics.
The Phenomenon of Epic Silver Rallies
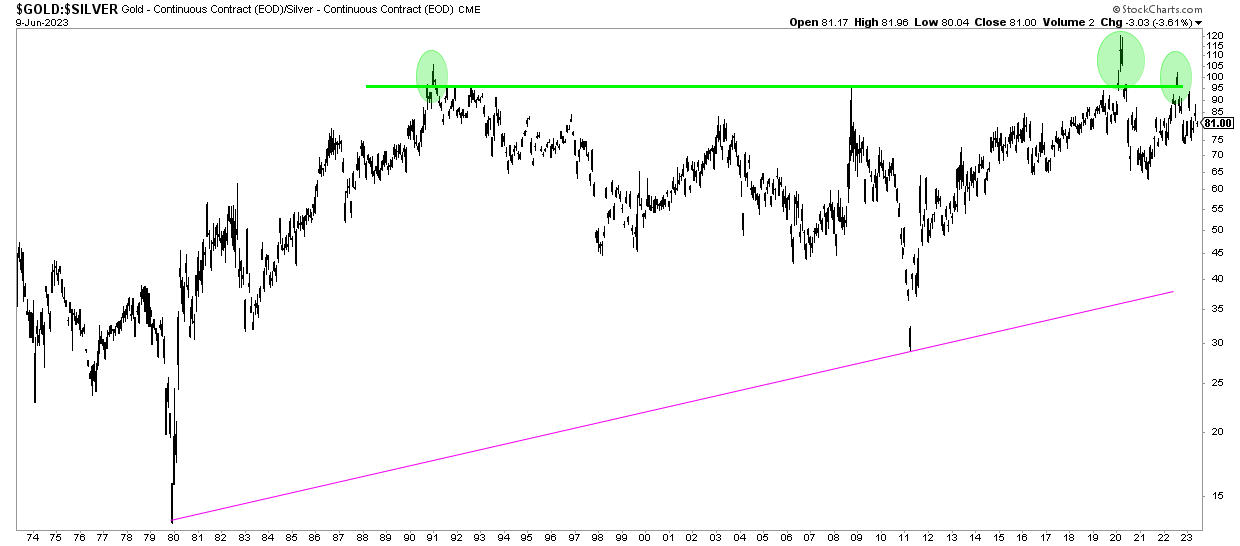
Over the past 50 years, a pattern has emerged in the gold-to-silver ratio that captures the attention of astute investors. Whenever the ratio enters the 80 to 100x range, it has consistently preceded epic rallies in the price of silver. Let’s examine four notable instances when this pattern unfolded: 1991, 2002, 2009, and 2020.
- 1991: A Catalyst for Silver’s Surge. In 1991, the ratio breached the 80 to 100x range, signaling a prime opportunity for investors. Following this event, silver experienced an impressive rally, with prices soaring over the subsequent years. The surge demonstrated the potential for significant returns and highlighted the importance of recognizing patterns within the precious metals market.
- 2002: A Repeat of Silver’s Triumph. Another remarkable instance occurred in 2002 when the ratio once again entered the 80 to 100x area. Silver responded with a monumental rally, solidifying the notion that this range acted as a catalyst for the white metal’s price surge. Investors who identified this opportunity reaped the rewards of a substantial market upswing.
- 2009: Seizing the Moment. During the global financial crisis of 2008-2009, the ratio surpassed the 80 to 100x mark, setting the stage for yet another spectacular silver rally. As market uncertainty prevailed, investors turned to silver as a safe haven asset, driving up its price significantly. This event demonstrated the potential for silver to outperform in times of economic turmoil.
- 2020: A Modern-day Phenomenon. In the wake of the COVID-19 pandemic, the ratio once again ventured into the 80 to 100x range, capturing the attention of investors worldwide. As economic uncertainties loomed, silver experienced a remarkable rally, affirming the pattern observed over the past decades. This recent event further solidifies the notion that the ratio can serve as a valuable indicator for potential silver price movements.
The Gold-to-Silver Ratio and Historic Silver Rallies
The historical evidence suggests that the gold-to-silver ratio entering the 80 to 100x range may act as a signal for a significant rally in the price of silver. At this very point in time, the gold to silver ratio chart embedded in this article shows how this ratio is above 80x since early 2022. This ratio is not a timing indicator, it is a stretch indicator. It suggests that silver is extremely undervalued relative to gold, it suggests that it’s a matter of time until spot silver starts reacting to the upside!
We offer detailed gold & silver price analysis, as a premium service, covering every week leading indicators of the gold price and silver price. Premium Service: Gold & Silver Price Analysis >>
In case you prefer to let us do the hard work while you focus on other challenges in your life, you might want to consider our unique passive income service >>


