Gold and silver were holding up quite well … until this week. On Friday, the day after ‘Black Thursday‘ it started with the palladium crash, and it dragged down all precious metals. With this, silver is now back at the 14 to 15 USD/oz level, after hitting 19 USD a few weeks ago. Unbelievable, but true.
In order to understand what is happening with silver we have to look at its weekly price chart.
A few things stand out:
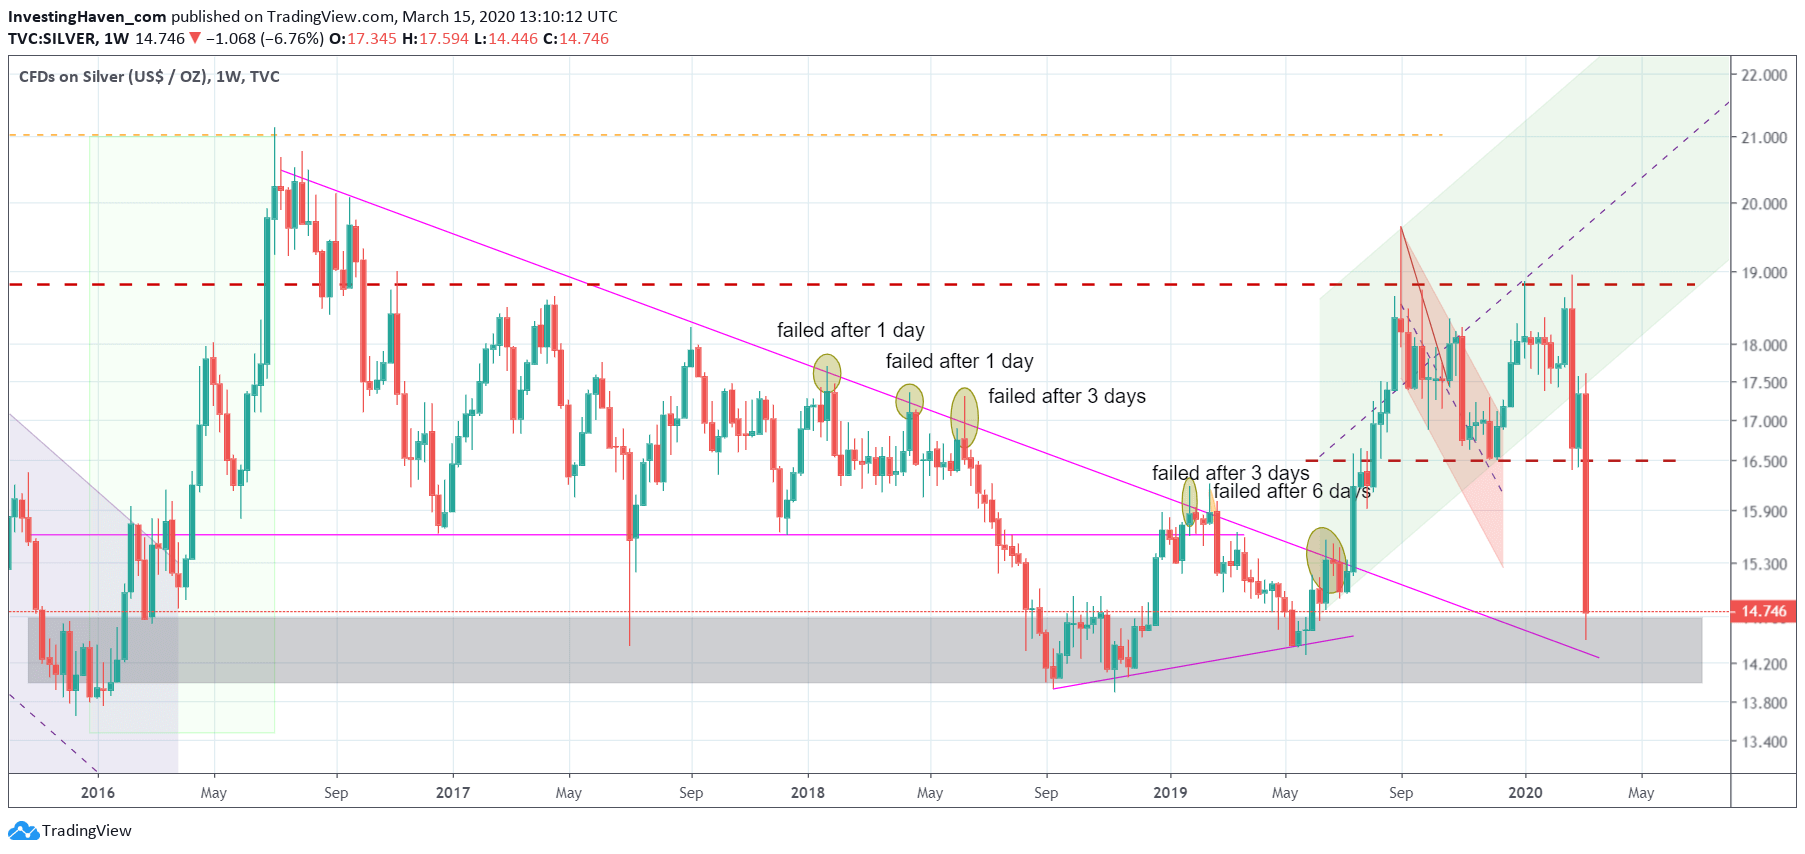
- The 2016 lows came in at 13.8 to 14.8 USD/oz.
- That same price level was thoroughly tested in the period Sept 2018 – May 2019.
- In the period 2016 – today we see a large though asymmetric M pattern. This is a reversal pattern. However what may be happening as well is that we are currently looking at the first legs of a W reversal pattern (Aug 2016 till Sept 2019 is the first V of the W, the last few months is the first leg of the second V).
We want to see 14.50 to 15.00 USD hold strong as support. We also need a bit more data to understand if this is a bullish W reversal on the very long term chart or a bearish M reversal.
We believe we are looking at a bullish W reversal which would conclude the bear market that started in May of 2011. No coincidence that this is happening right at a time when the Aussie is testing the completion of a giant 17 year commodities cycle.