The bear market in crypto feels like it has no end. Every attempt in Bitcoin to stabilize is disrupted. We continue to expect at least one bullish wave in crypto in 2023 as per our crypto forecast and our long term bullish XRP forecast. In this short post we look at the long term BTC chart. Doesn’t look bad, does it?
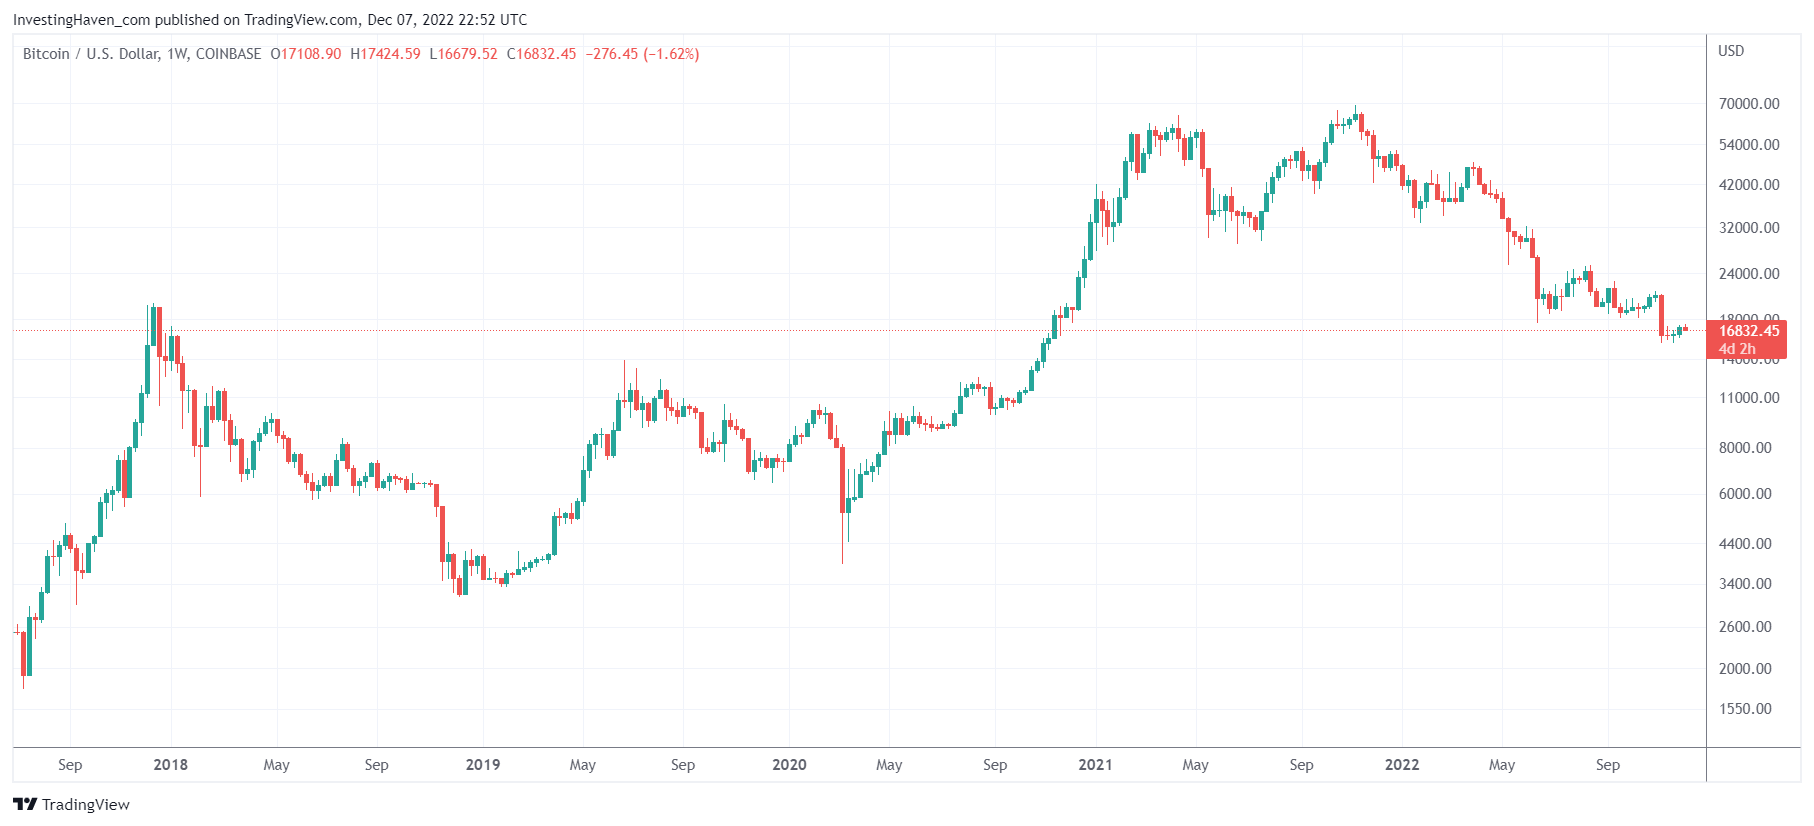
No leading indicator analysis in this article, no long analysis, no forecast, only one chart: BTC on its weekly timeframe even without annotations.
Very often, it helps to remove any annotations and look at charts in the cleanest possible way.
The long term BTC chart since summer of 2017 has 3 distinct phases:
- The bullish W reversal between 2018 and 2020 with the breakout occurring in November of 2020.
- The topping pattern, sort of an inverted W (aka as bearish M pattern), in 2021.
- A new structure since May of this year which starts looking like a bullish reversal, not entirely confirmed yet.
Interestingly, phase 3 is occurring right at the January 2018 highs, below the 2017 top, but still well above the June 2019 highs. The price point that is currently holding up is 16666, a 75% decline since the peak at 69k.
In the end, BTC is currently consolidating right at its breakout area which we consider to be 12k – 16k.
If BTC continues to be trendless and hold its recent lows, we could really see a very nice long term set up here with at least one major move higher not later than summer of 2023.