
Crypto investing very often comes with excitement as a result of rising prices. Anxiety comes with falling prices. The recent uptrend in Solana has triggered a lot of fascination. Investors’ emotions typically start dominating their thinking, especially as they start focusing on Solana fundamentals are SOL’s long term price target.
Beyond excitement, beyond bias, beyond emotion, there is a very powerful message available on Solana’s chart: the 88-day uptrend, coupled with an $88 surge, goes beyond mere numbers – it’s a harmonic time/price setup that deserves a closer look.
Solana’s uptrend may result in bias
Amidst the thrill of climbing values, investors can easily fall into the trap of biased thinking. The surge in excitement tends to create a loop where information sought aligns with bullish biases, overshadowing the critical need for a well-planned exit strategy.
Relying too much on fundamentals is a typical result of a hot market.
Be careful, bias creates bad decisions as explained in great detail in 7 Secrets of Successful Investing.
Solana’s chart and our unbiased eye
This is where the chart comes in handy. While fundamentals are undeniably crucial, the chart provides a visual representation of market dynamics. It can help you by acting as an unbiased guide amid the emotions driven by wild price swings, in both directions.
Consider this a nugget of investor wisdom: let the chart be your unbiased eye in the market storm. Charts, devoid of emotion, offer a realistic perspective, a visual representation of a market’s journey that can be overlooked in the excitement of rising values.
Applying wisdom to Solana’s chart
Now, let’s apply this wisdom to Solana’s recent performance. The 88-day upward trajectory is more than just a numerical curiosity; it’s a visual ‘harmony’ on the chart. Focusing on the chart reveals the magic number 8 on both the time and price axes, prompting us to ponder the broader implications beyond the bias of fundamentals.
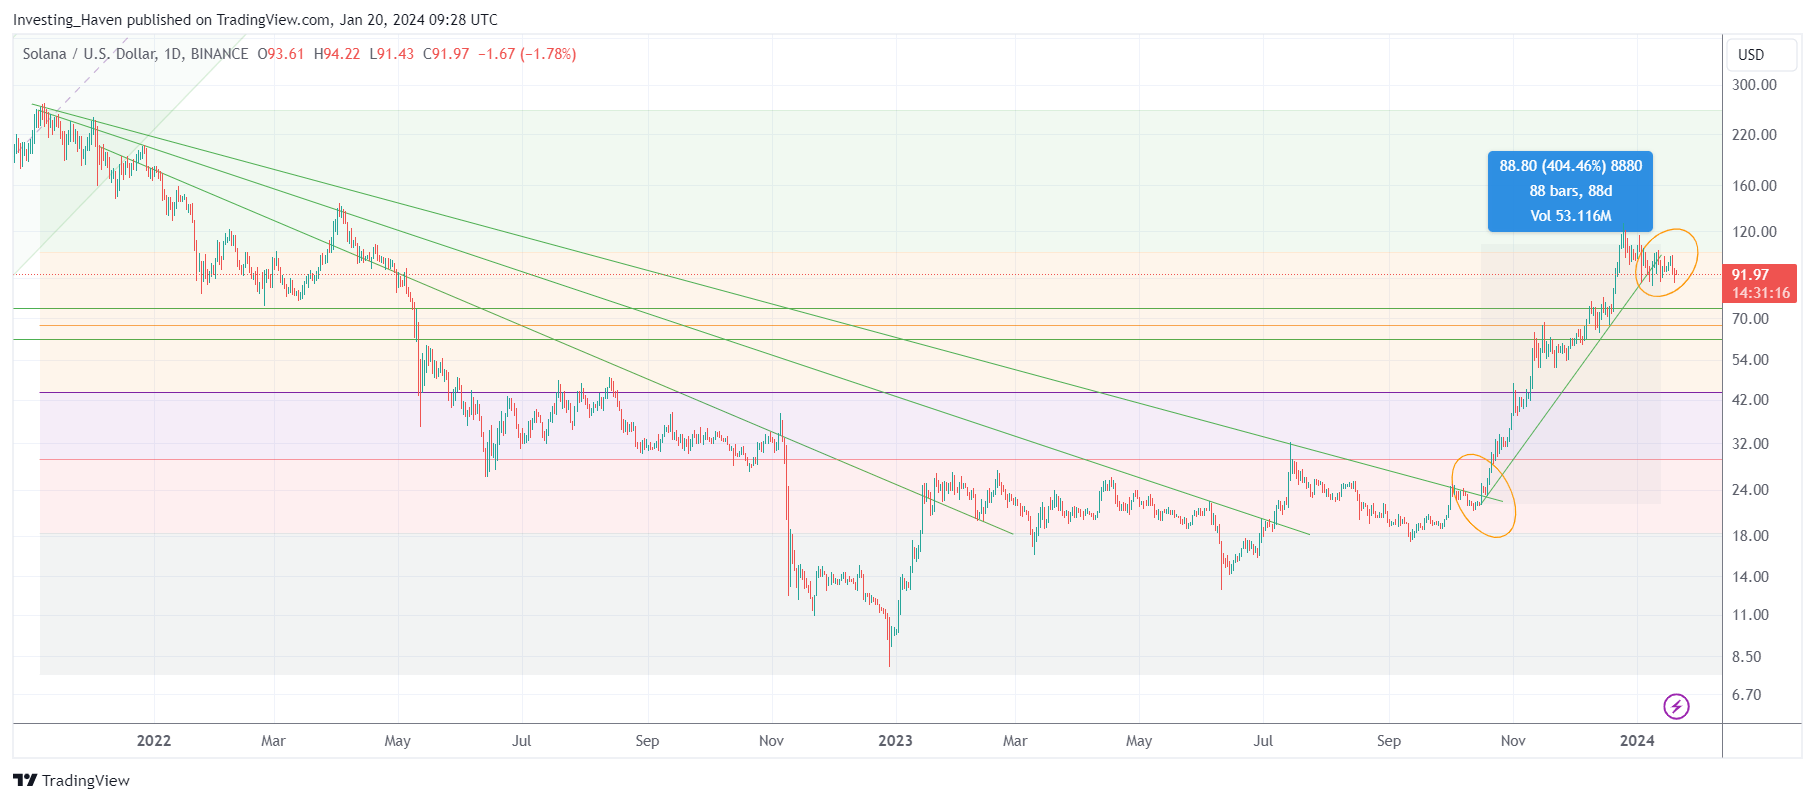
Below is Solana’s daily chart, also featured in previously written articles like will the price of SOL rise in 2024 and SOL trending to $250.
What matters is the grey box – 88 days of an uptrend resulted in price appreciation of $88. This is no coincidence. It certainly is no voodoo nor conspiracy. It’s plain and simple harmony, an harmonic set up.
What this means? Very simple – a strong uptrend. This implies that the strong uptrend is over now, for now, trend completion. Solana requires a break which is healthy price action.
None of this will impact our long term targets by the way, but investors may look into other directions to find ‘the next Solana.’
Implications for investors
Thinking beyond fundamentals is an important skill. It is a mental skill which requires training.
The chart, with its simplicity and clarity, acts as a complementary source of information, providing insights that might not be immediately apparent in traditional analyses. Understanding the interplay between fundamentals and chart patterns enables investors to make rational, hence profitable, decisions.
Looking for ‘the next Solana?’ We may have found it. In our latest premium service alert, we tipped this one token that may go up 800% in 2024 – please read this alert (after signing up): This Cryptocurrency Can Rise 5x, Up to 8x, Provided ‘Narrative Effect’ Kicks In.