
LINK set ATH on May 10th, of 2021, when it touched $52.70. It will touch $52.70 again in 2024 or 2025, provided $16.91 is broken to the upside on a 5 to 8 day closing basis.
Chainlink is an oracle network that acts as a “link” between Web3 and traditional products. This is a sound use case, as it offers a means for the burgeoning world of Web3 to interact with real-life services.
The ecosystem has made a considerable number of partnerships and an 18-month boring consolidation from the charts could be indicative of bullish momentum. It’s also in a great sector (Oracles and Big Data).
See related: 2024 Is A Hidden Crypto Bull Market.
Let’s take a look at the crypto asset and give a charts-based Chainlink (LINK) price forecast for 2024 and 2025.
Fundamentals fail to tell the full story
A continual error made by casual investors in trying to make price forecasts is a reliance on fundamental analysis. Fundamental data relates to how the network is performing on a more basic level – chiefly upgrades, users, partnerships, and on-chain data.
However, such info is clumsily translated into arbitrary numbers, based on no real methodology.
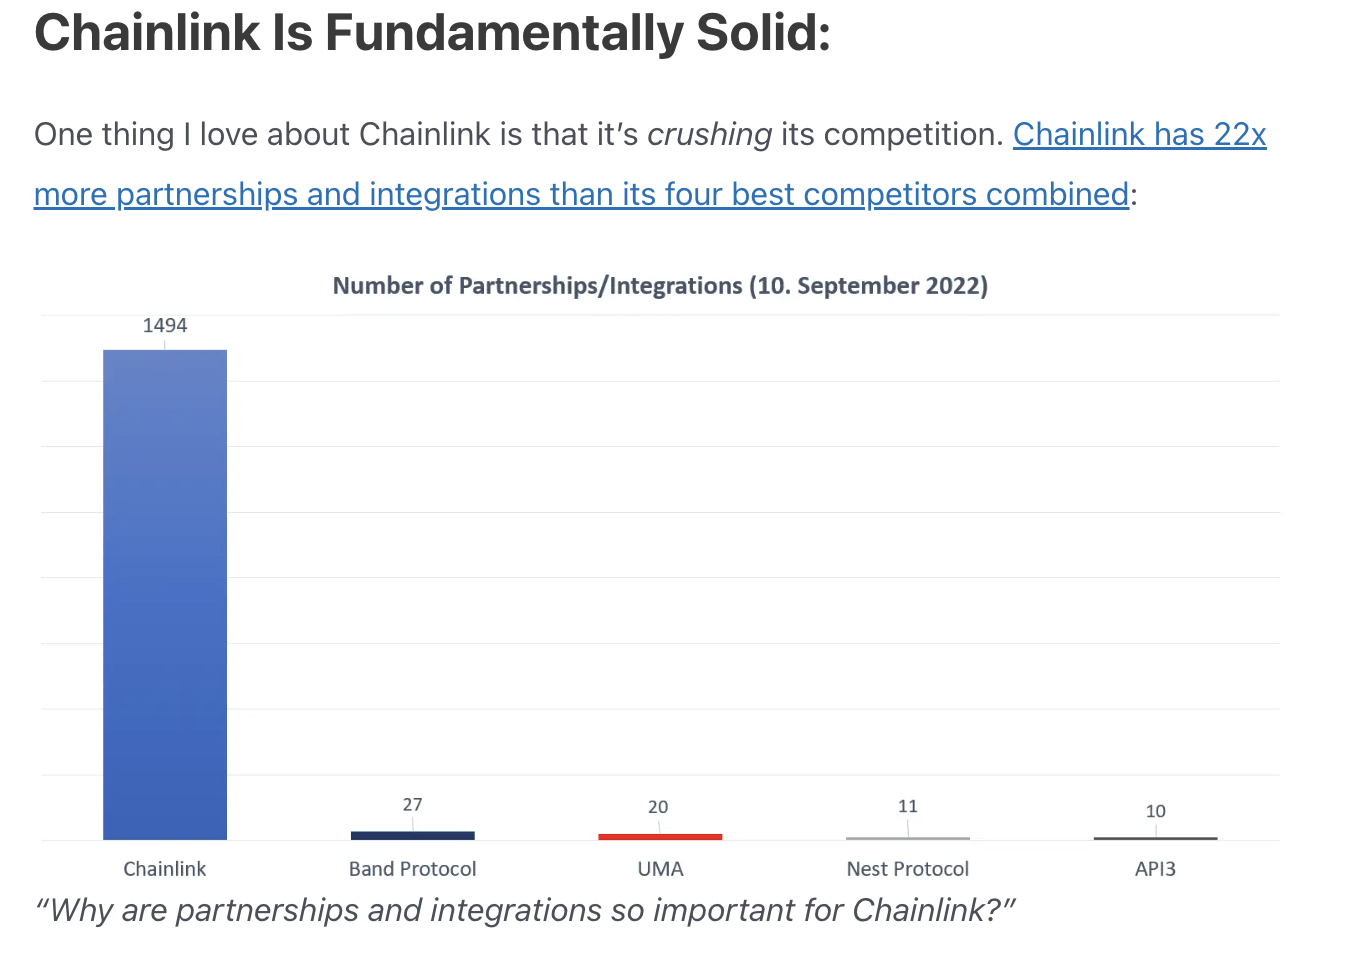
The Chainlink prediction from this analyst forecasts LINK to $1,000 based primarily on the fact that it has more partnerships than its competitors. Obviously, this is useful information. But there is no real method for translating positive fundamental news into an accurate price multiplier. It might mean a 2x increase, a 5x increase, a 10x increase, or a 50x increase. $1,000 is not substantiated by any charting information.
We’ve seen this happen so often. Fundamental information basically means that a network is doing well and it should correspond to a price increase at some stage in the future. The charts then tell when to buy and when to sell at specific points.
Fundamental information is the first stage. The expertise and sophistication come with the charts. If you don’t have a precise entry and exit point, then you’ll find it difficult to manage your portfolio.
A more refined perspective
The ‘analysis’ above also makes the mistake of converting market cap into financial rewards. So, the idea is that if the overall crypto market cap grows by 10x, the coin will also increase identically by 10x, which is a gross oversimplification of what really happens. Relying on this kind of positive thinking and social sentiment can have terrible effects on your overall ROI.
See related: 2024 Is A Year of Asymmetrical Returns In The Crypto Markets
We do agree that LINK has made some impressive partnerships and is a sound network. The sector (Oracles) is also attractive, as mentioned in our recent article on Pyth Network.
But based on the charts (and using the same fundamental information as the investors above) we forecast the token to be in the $100 zone between 2025 and 2026, not $1,000. That’s a significant difference, and we outline various points of entry using the daily and weekly charts.
Chainlink (LINK) price forecast: per the charts
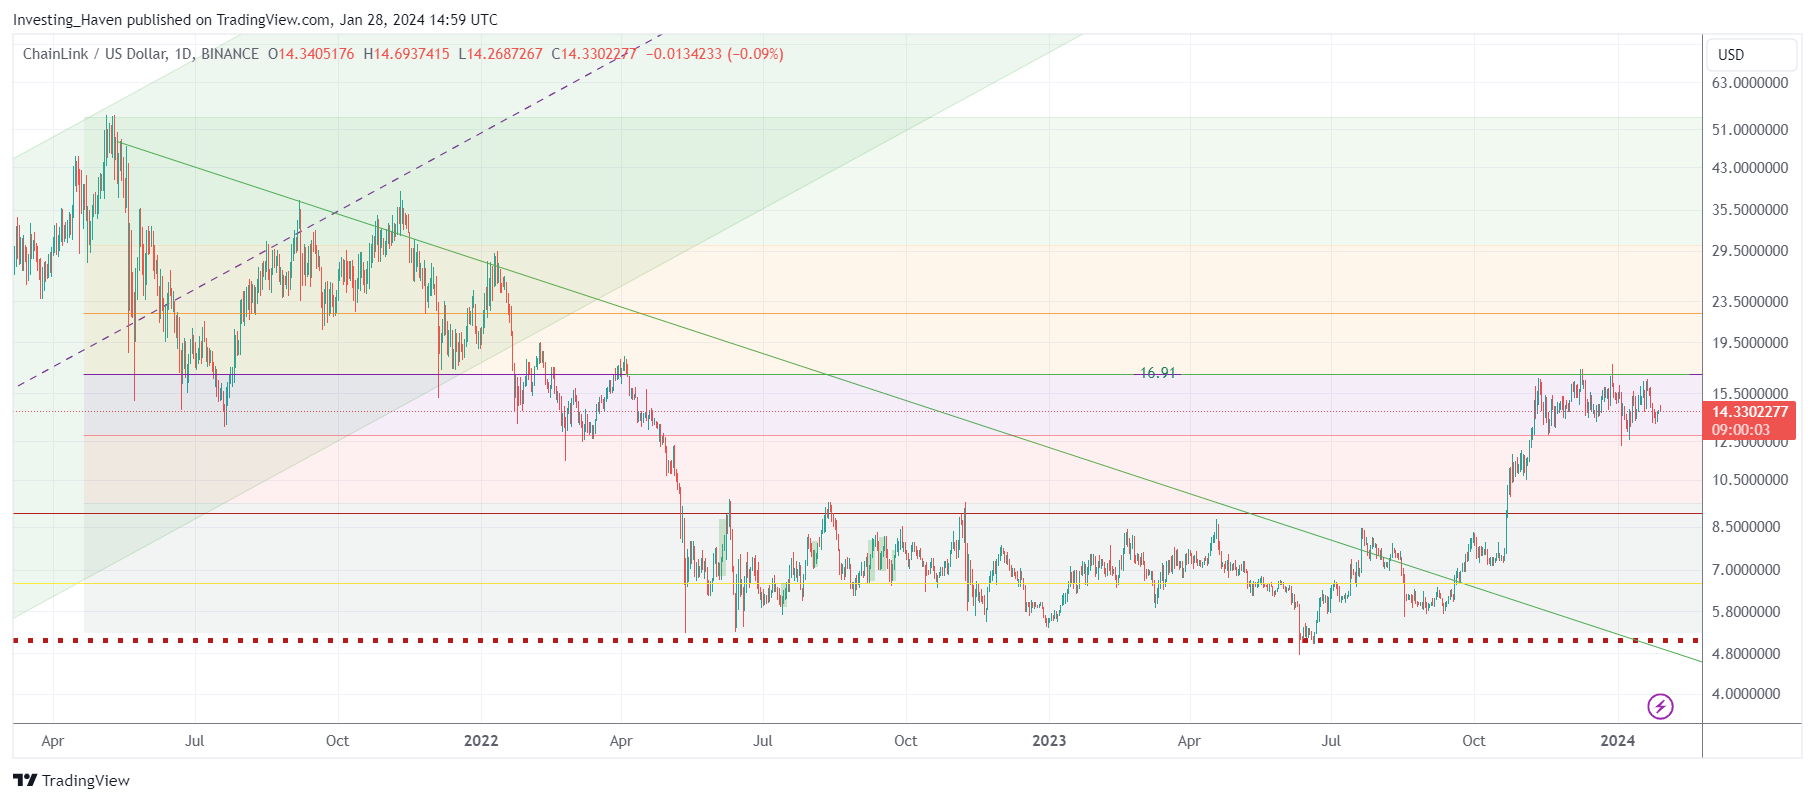
The daily chart for LINK reveals an 18-month consolidation, which turned bullish towards the end of 2023. The most important level to watch here is $16.91. Once this is broken through, levels of $22.6, $29.9, and $54.0 will be tested (as per the daily chart)
While the 18-month consolidation might look boring, it is a bullish occurrence because it signals an upside breakout. As we repeat, periods of consolidation are necessary before a breakout. When most get excited, is when we get bored and leave the table.
 The weekly chart allows us to filter out some noise and see things more clearly. The highest level chart structure is an ABCD pattern (AB 2019-2021, BC 2021-2023, CD 2024-2026). From the weekly chart, $16.91 is also a key figure. This level is likely to act as a support zone after the initial breakout has taken place.
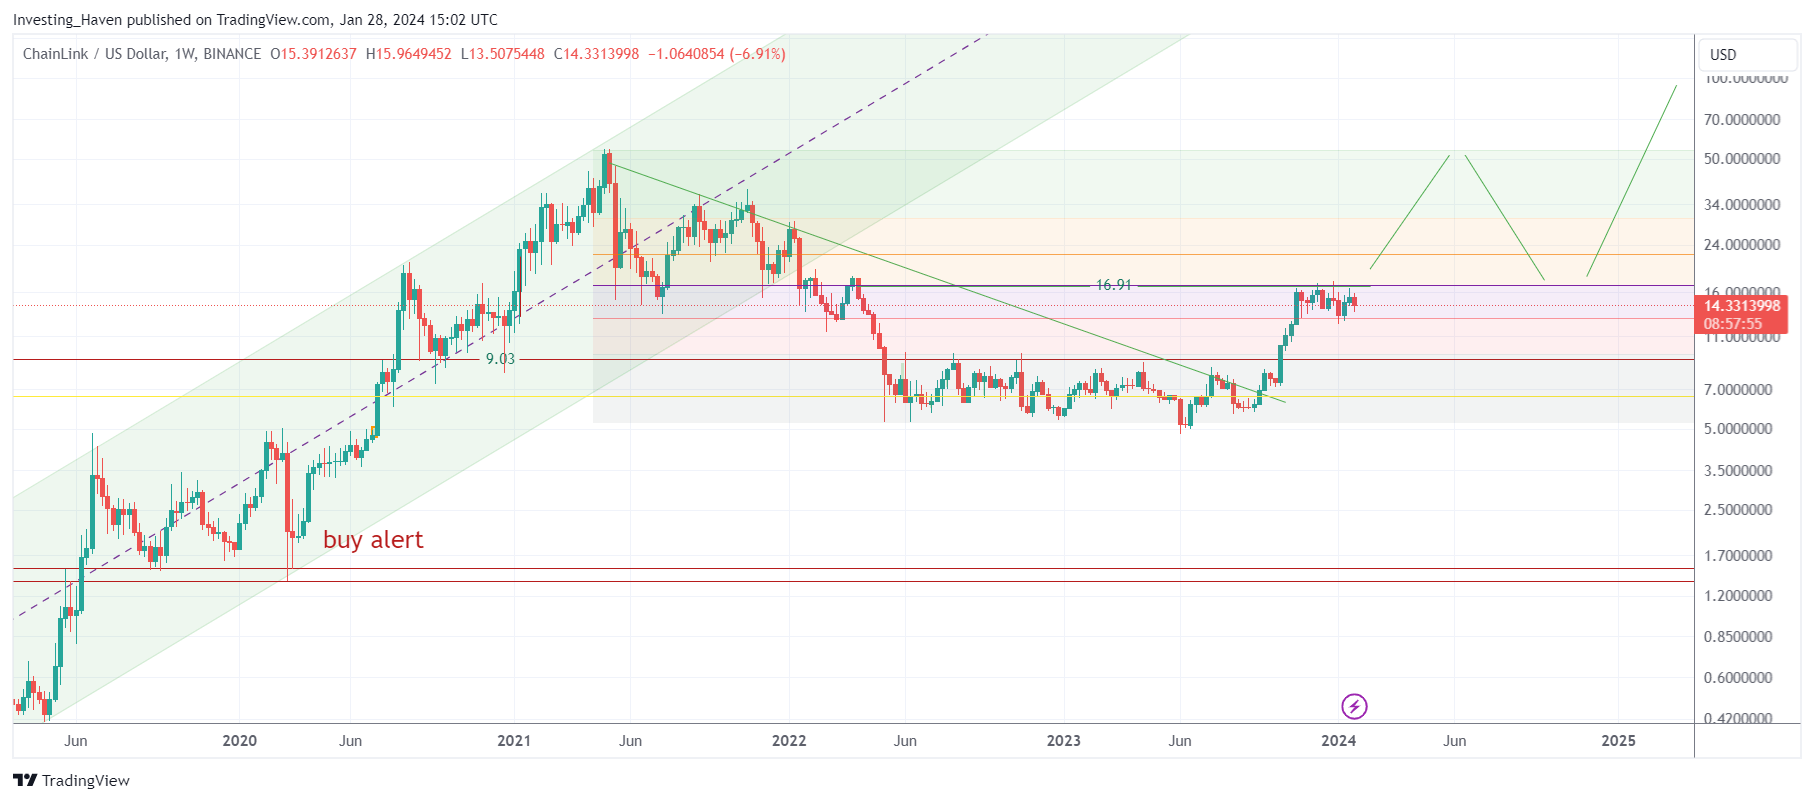 Throughout 2024, it is likely to hit $54.0 before a retracement. In 2025, it could reach up to $100.
These price points are based on chart analysis – a $1,000 prediction has no correlation with the data.
Chainlink price forecast to $100
Based on the charts, LINK can reach $100 by 2025. In the meantime, we can see an upside to $52.70 throughout 2024, once the $16.91 zone is broken through.
LINK was one of our previous 10x calls to premium subscribers, all the way back in 2020. We have a history of generating strong returns for clients.
We have more 10-baggers at hand, for investors and traders who are eager to make real returns based on solid data.
See our premium alerts service for timed entry and exits on specific coins.
Disclaimer: This is not financial advice. Please consult with a licensed financial advisor prior to making any investments.