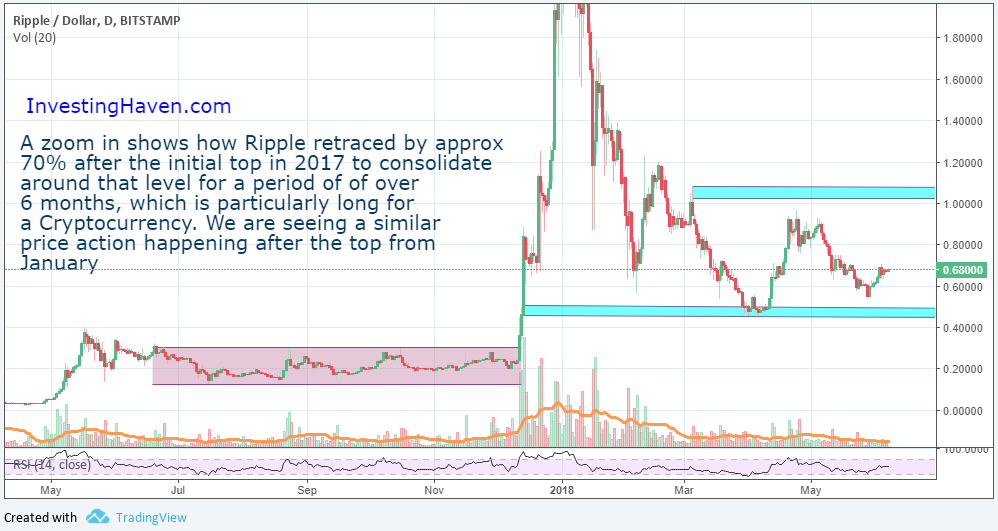
Ripple price consolidated for a long period and under performed for most of 2017 before a spectacular breakout where it outperformed Bitcoin and even Ethereum. The price action discouraged many investors looking for the quick wins in Crypto. But for those who were patient, the returns were worth the wait.
Note that we wrote this just one week after Ripple’s major peak, and we still feel very strong that this call is accurate and actual: Ripple’s Price Flash Crash After It Peaked
The story couldn’t be any clearer: After a major run, Ripple price reached the top of the ascending channel and retraced. It is to be expected that this important resistance will not be broken as of the first attempt.
At the moment of writing we are seeing a similar setup in the making for 2018. Ripple price chart shows that there is a pattern to the price movement and that’s what we will cover in our article today to try to understand what the next move will look like for Ripple.
An important pattern in Ripple’s price chart
The pattern we are referring to is actually very clear on the chart: A breakout, a 75% retrace followed by a long consolidation period. The pattern is shown clearly in the the first chart and the details are clearer as we zoom in in the second chart below.
Note: this article contains charts and analysis that is only available to premium subscribers from InvestingHaven’s blockchain investing research. Subscribers have this type of analysis for all top cryptocurrencies and top blockchain stocks, as well as weekly updates and buy / sell alerts.
We will be watching for the break of 1 USD to the upside which could lead to another breakout for Ripple. This breakout needs to happen with a strong volume, otherwise, it might be a fake breakout. The other factor that will impact Ripple’s upcoming performance is Bitcoin’s price since it remains the leading indicator of market sentiment for Cryptocurrencies.
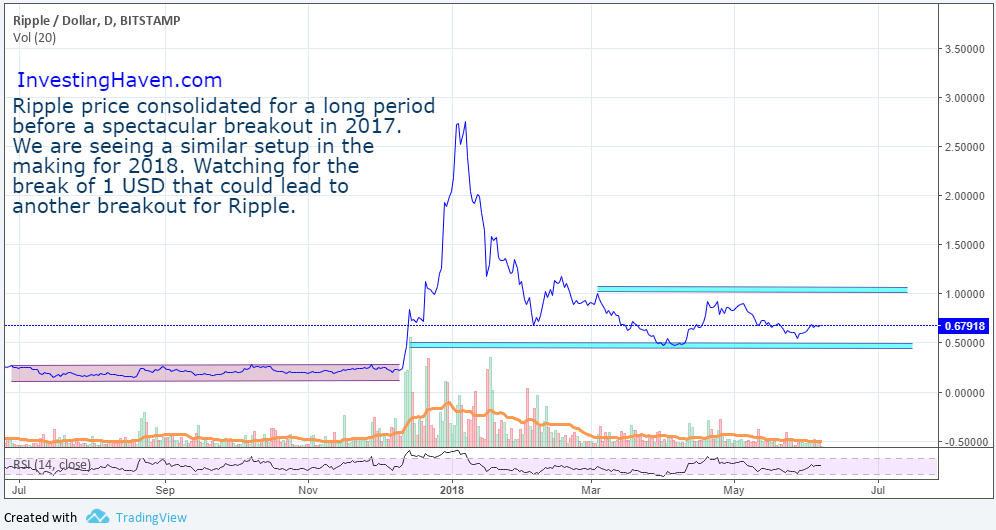
What can investors expect in terms of price performance for Ripple? We believe a consolidation in the 0.50 USD to 1 USD is likely to continue till the sector recovers. The recovery will be signaled by Bitcoin breaking out above 12,000. Once that happens, a breakout above 1 USD for Ripple, paired with a strong volume will lead to higher prices for Ripple in 2018.
Ripple remains Bullish as long as it trades above 0.50 USD and we see the potential for a major breakout in 2018 similar to what happened in 2017. The longer the sideways movement the better as shown by the chart below.
From a fundamental perspective, Ripple’s adoption for pilots with different banks continues and that’s a very good sign for investors. Ripple is also being enhanced as the team published 2 whitepapers this year to improve the Cryptocurrency’s connectivity between different nodes as well as the verification of transactions which for sure will resonate with more banks and adopters.