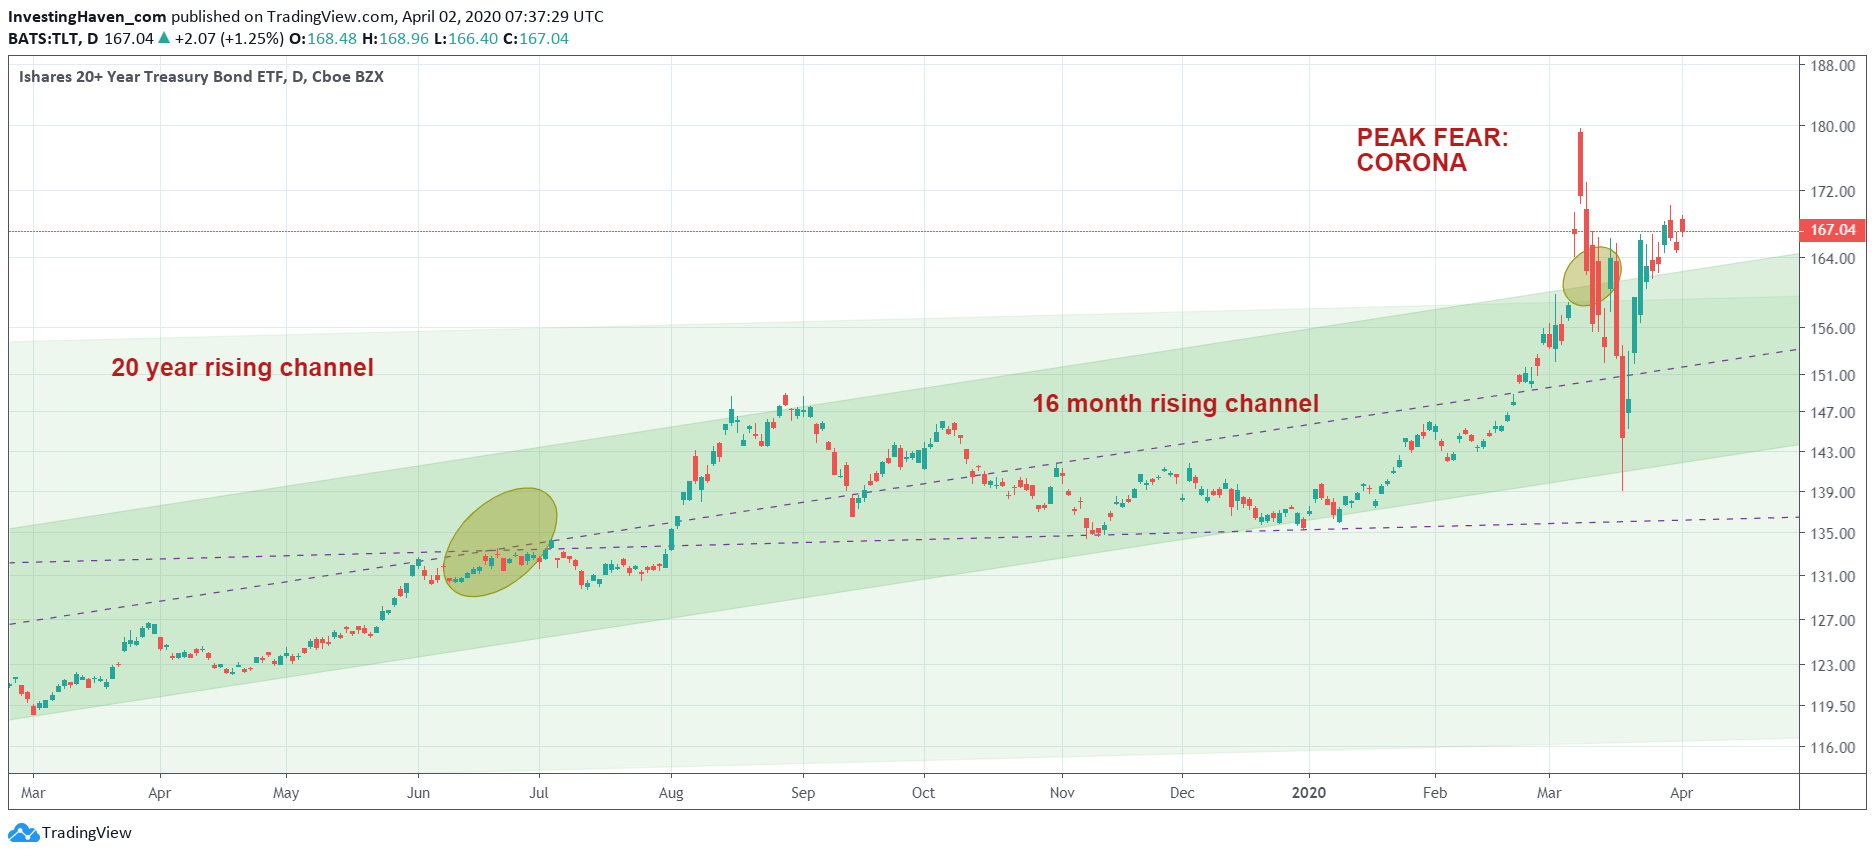
Right before Black Thursday and Black Monday, both within 3 trading days which is the type of devastating sell off that never occurred before, our fear indicator TLT peaked to all-time highs. The chart below shows the extreme peak which indicates fear. We also call it ‘peak fear’, based on the assumption that it truly peaked. But was it THE peak or was it A peak? The way TLT is rising in recent days could make us think that it was just one of the peak, and another one is underway.
The chart below says it all.
In the first week of March the TLT did set an exponential peak. The magnitude was enormous, and the long term chart is even more impressive than the daily featured in this article.
One week later this fear indicator “spilled over” to other markets. Subsequently we saw Black Thursday and Black Monday.
Right now we see the TLT rise again above its 2 channels: both the 16 month rising channel as well as the 20 year (!) rising channel.
We have to pay attention to this indicator. Once above 170 points we can reasonably expect another stock market sell off.
We stay on top of these trends, and give much more detailed updates to our premium members. Moreover, we protect our premium members in our short and medium term portfolio. In our short term portfolio we booked serious profits (up to +49%) in the first quarter by taking bearish positions through inverse ETFs. In our medium term portfolio we closed the quarter with a small virtual profit.