
The Dow Jones Index is in the process of what we call ‘breaking up’. A ‘break up’ is a term that comes from InvestingHaven research team, and is much more powerful to investors that what many know as a ‘breakout’ for reason we’ll explain in this article. If this ‘break up’ in the Dow Jones Index persists we will see our Dow Jones Forecast For 2021 materialize, another one of our many market forecasts that might be realized. Note that we also updated the Dow Jones 20 year chart as well as the Dow Jones 100 year chart, both are worth your time and even qualify as ‘spectacular’.
Let’s expand on the notion of a ‘break up’, and why it is so important to investors.
A ‘break up’ is when an asset moves ‘one level higher’. A ‘breakout’ is when an asset moves outside of a chart pattern, the most popular version of a breakout being a triangle pattern.
A break up is important to investors because it provides a great entry point which also comes with a great stop loss. At InvestingHaven we try to define our stop losses combined with the entry point. Both are equally important, and defining a good stop loss as a requirement for an entry point can help tremendously to determine whether to stay in a position or not.
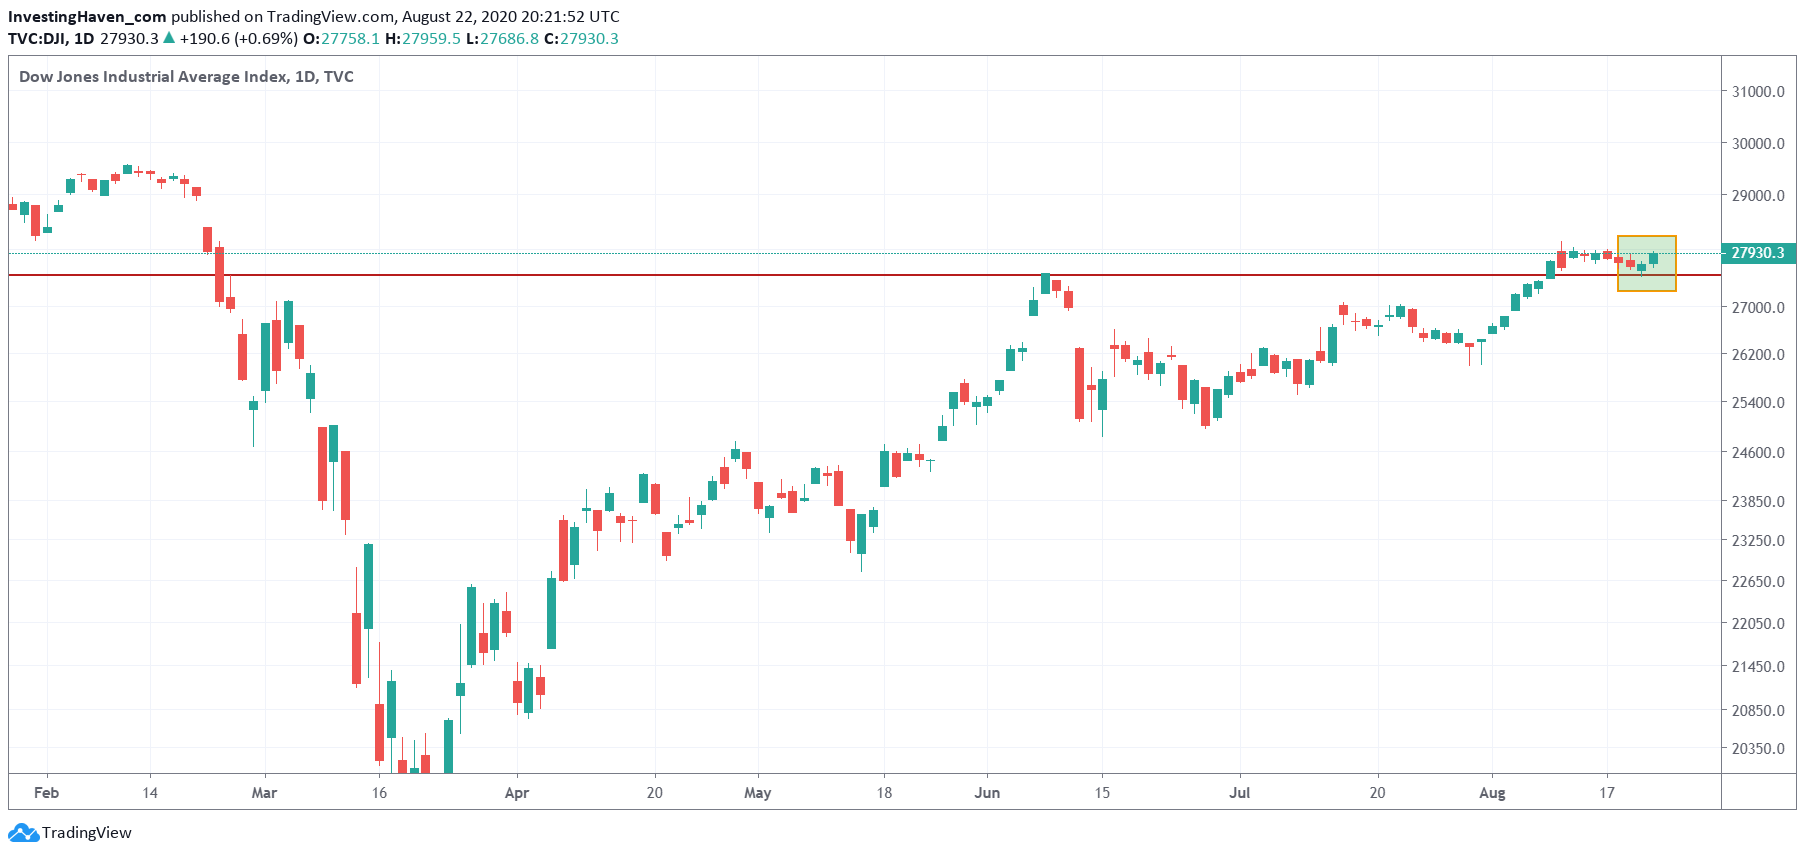
That said, we now see on the daily Dow Jones chart how the index is in the process of confirming its break up, see the green box on below chart. We like this setup a lot, and believe it will hold. The next 3 trading days will be decisive in getting this confirmation.
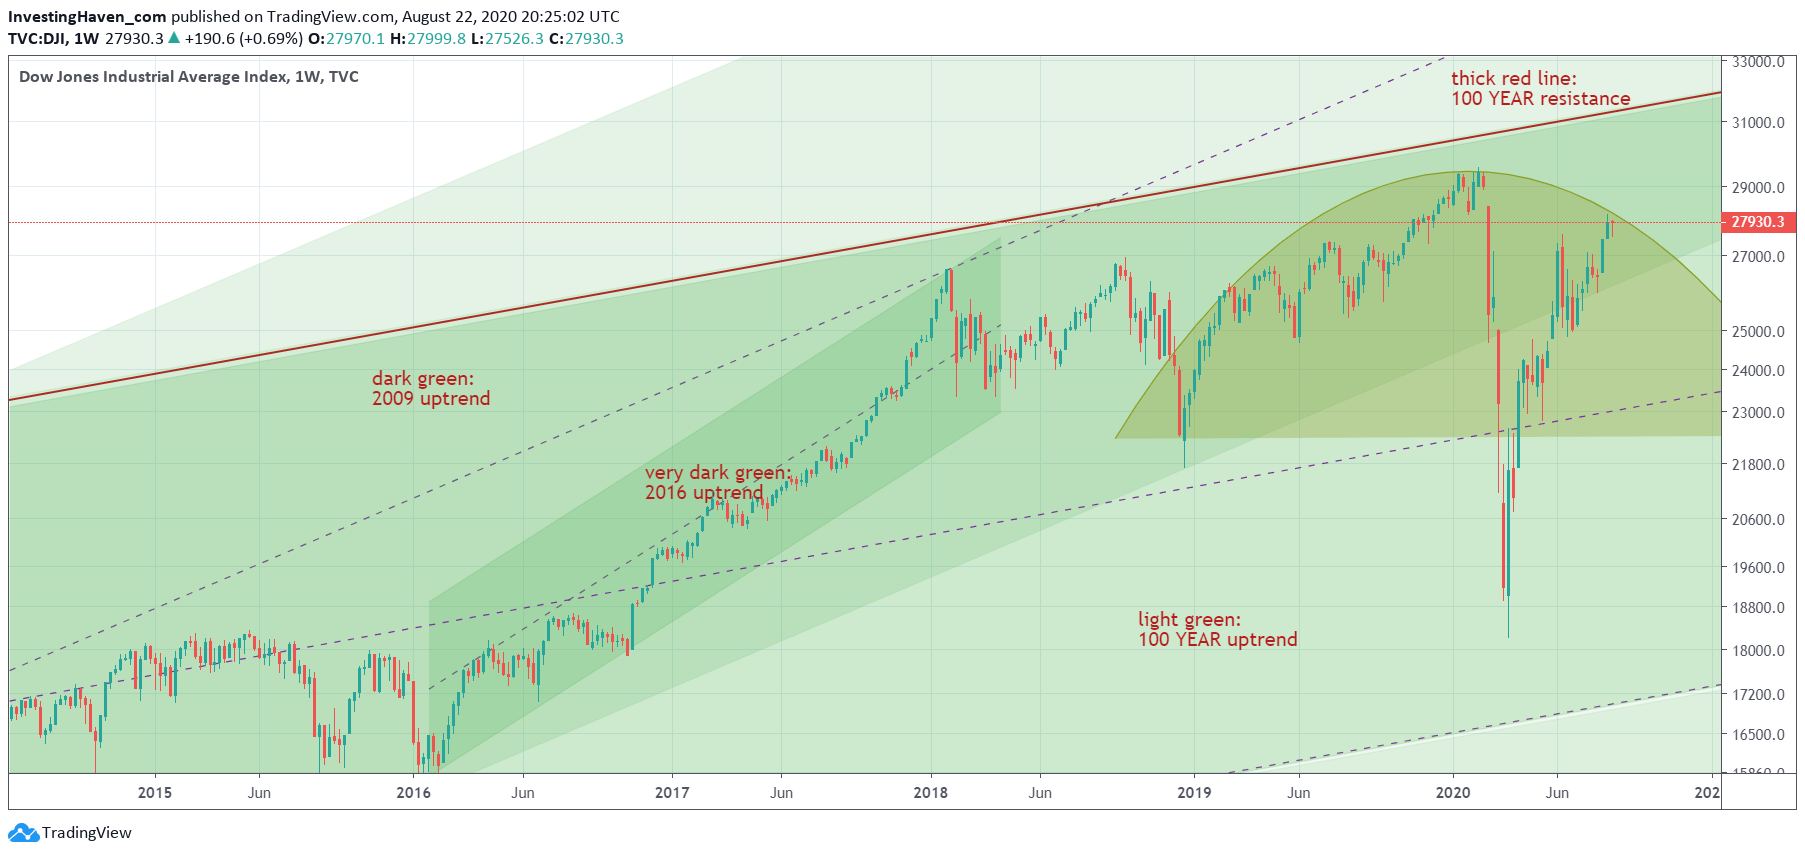
When we put this daily chart into context, and zoom out to a 6 year timeframe (weekly chart below) we also see that the break up is happening at a very crucial spot on the chart.
The bearish formation is being tested right now. If the daily chart continues to provide support to the Dow Jones Index, we might see an invalidation of this bearish setup on the longer timeframe. This would be the ultimate confirmation that our Dow Jones forecast is underway.
Enjoying our work? We use the concepts outlined in this article constantly in determining entry and exit points in our Momentum Investing methodology. Also our Trade Alerts premium service used proprietary analysis and decisioning concepts like the one discussed in this article. So far, this year, our combined portfolio is delivering +50%. We are on track to double our capital in 2020, as per our Mission 2026.


