
InvestingHaven’s focus is mostly medium to long term. That’s why we never make short term forecasts. However, adjustments in the set of leading indicators if and when they apppear must be spotted in the short term. This article looks at the question whether we need to make a market forecast adjustment based on the price changes in March 2019. We do so based on 4 charts, and try to understand the probability of a stock market crash in 2019, an event the vast majority of investors are anxious about. Similarly, this market forecast should be supportive of our TOP 3 investing opportunities which we revised in this opportunity prediction.
As said many times before, and defined in our 100 investing tips, major moves in global markets come after major moves in currency and credit markets.
That’s why we look both the Euro as well as the 10-year Yield chart. We consider both of them as leading indicators.
This is contrary to the belief of many investors that they should read news to forecast markets. As said, news is a lagging indicator. Smart investors have a solid method wit leading indicators ‘from within’, and they stick to their method.
Market Forecast Method: Leading Indicators Revised In March 2019
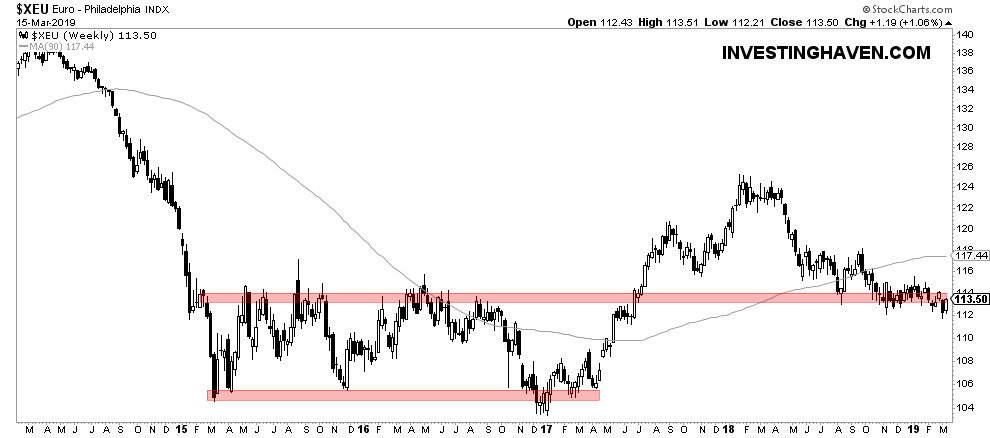
The first chart shows the Euro, THE most important currency with predictive value. It clearly is testing an important support level. As long as there is no fast move below 112 points there is no reason to be concerned whatsoever.
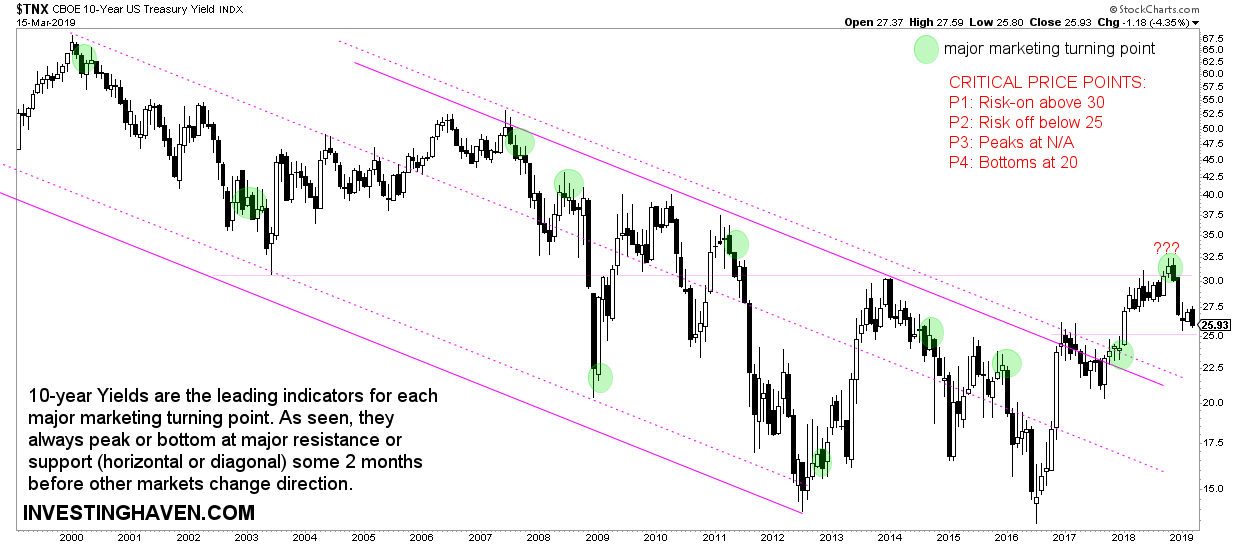
The second chart is 10-year Yields. On purpose, we used the long term timeframe.
The point here is that 10-year Yields have a challenge. The area below 22 points is bearish for risk assets like stocks. The area above 30 points are bullish for risk assets.
Between 22 and 25 points it is unclear. It might be considered the ‘twilight zone’ because it is still above the falling channel. This is the joker. Is there a way out or are we in the dark now? Yes, any fast move in 10-year Yields combined with a fast move in any other major asset (class) is what we are looking.
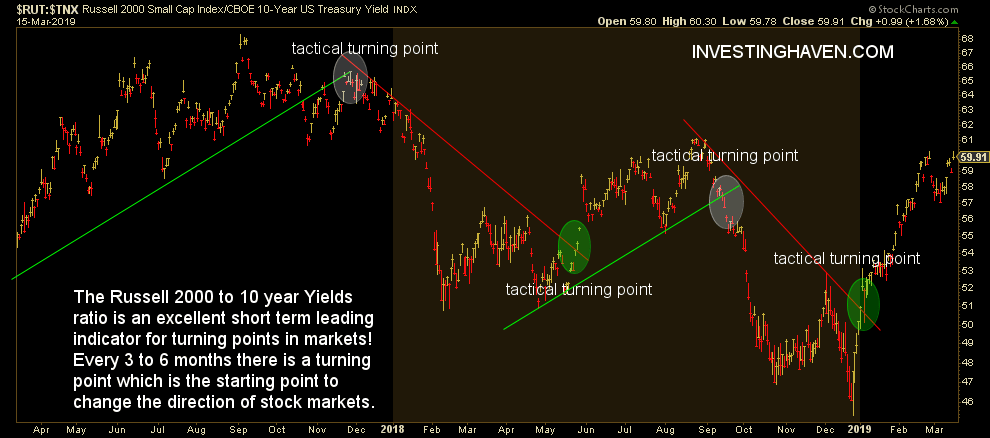
The third indicator is the Russell 2000 (RUT) to 10-year Yields ratio.
If it moves higher it favors risk assets. In March 2019 we see a move supporting risk assets, primarily stocks.
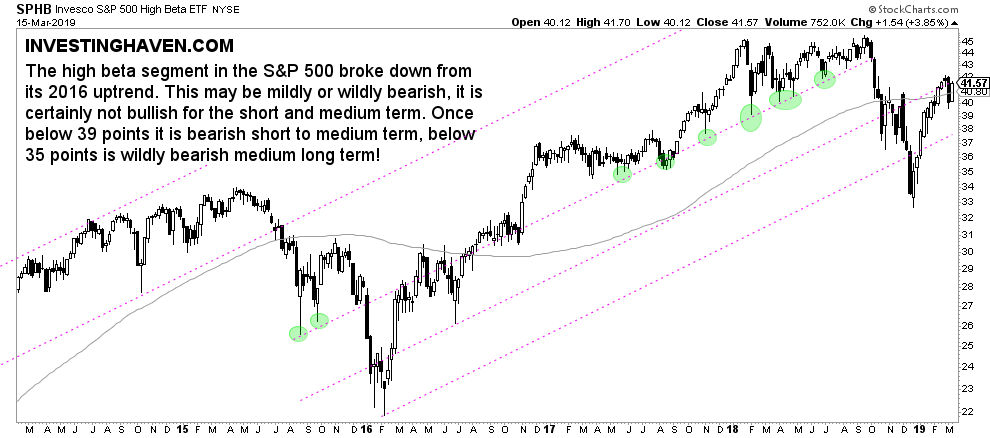
Last but not least, high beta stocks in the S&P 500 index (SPY) are moving higher. They are touching resistance though, and it is an important price level.
So far, no harm done, but stock bulls really want to see an aggressive move higher above the current price level.
Market Forecast Adjustments Required In March 2019?
So what do we conclude out of the 4 data points we revised in this article? Is any adjustment needed in our market forecast?
We do not believe any adjustment is needed. We remain bullish on global markets in 2019.
The Euro chart is not concerning as of yet. The chart of Yields is in a twilight zone. We don’t see any other major asset class sending a warning sign on conjunction with the chart of Yield.
The Russell 2000 to Yields indicator looks promising at this point in time. High beta stocks in the S&P 500 similarly, though they need more work.
In sum, so far so good. As always, anything can happen, and we will revise our market forecast when appropriate!


