The price of gold is up 8 percent since the start of the year. However, from last year’s highs at $1380, gold is down almost 11 percent. With regards to the long term gold (GOLD) price, we made a bearish call in our gold price 2017 forecast. Because of that, we suggest not to buy gold mining stocks in 2017 yet, but hold on just a little bit longer.
In order to know whether gold is on track to meet our gold price target, what exactly should investors look at? That is an important question because nobody should be blindly making forecasts, including ourselves, nor should anyone ignore important trends after making a forecast. With that in mind, we challenge our own view on the gold market, and answer the question what we are looking at in order to know for sure whether gold will be bearish in the coming months (or not).
The clue in answering this question mostly resides in combining charts on two timeframes. That may sound simple, but the insights that investors can get out of it is very powerful.
The long term chart was discussed in this previous article 10 insights from gold’s long term price chart. In essence, we made the point that gold’s long term bull and bear markets move in clearly defined channels. So trend lines are as important in the gold market as they are in any othe market. Moreover, the long term chart reveals an important insight: gold will only enter a secular bull market once it trades above $1350 (that price will decrease over time, so investors should follow the bear market trendline on the chart in the article closely).
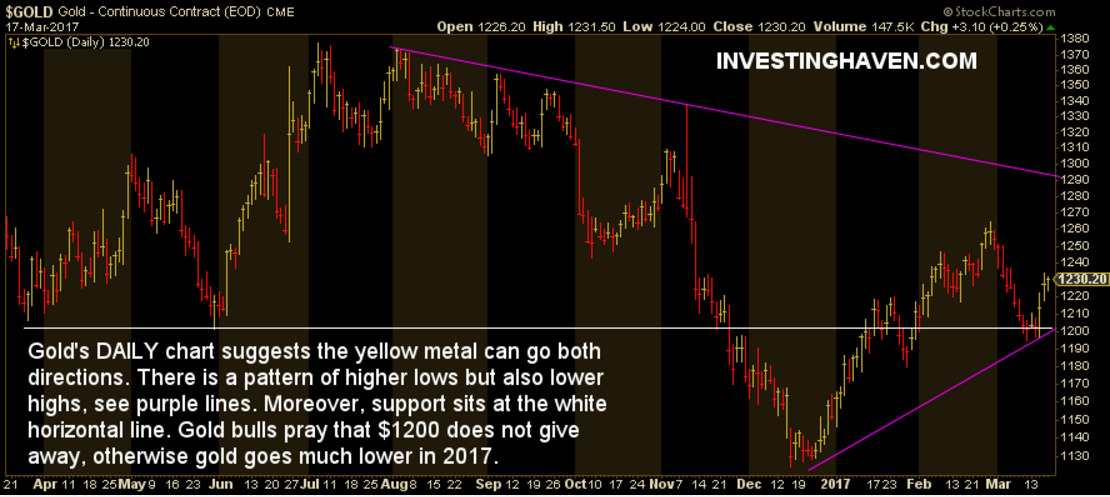
The short term timeframe provides additional insights, because, in general, short term timeframes reveal the start of new trends in more detail. Therefore, we look at the daily chart, seen below. Interestingly, the daily suggests that both bull and bear forces are at work. In other words, there is not trend (yet) … but the chart also shows which prices have a predictive value.
First, gold could is setting a pattern of higher lows (which started in December last year) but also a pattern of lower highs (which started last summer). Now that is exactly what a triangle formation stands for: it reveals a fight between bulls and bears. Above $1290, gold will be bullish on the short term timeframe, and investors can enter a buy position until resistance on the longer term timeframe is met. Below $1200, things look very nasty, moreover as $1200 coincides with a support area which goes back one year (white line). That is why $1200 has a very important meaning. Once gold goes below $1200, things look bad.
In sum, the daily chart (short term timeframe) reveals the importance of $1200 as a very decisive price level for a continuation of gold’s bear market. The $1290 price level is a decision point for a bullish scenario.