If 2018 started with a spike in volatility, 2017 was a year that will be remembered for its historically low volatility. So while some financial media outlets are still referring to the sharp retrace that happened early February 2018 as a crash, our research Team shared a rather positive outlook for the stock market in 2018. Today, we will cover another chart that points towards the same conclusion.
Is the Stock market about to Collapse in 2018?
Investors are right to watch the stock market closely, and that’s because an important indicator is making a very important move: We are referring to the U.S. 20 year yields, a leading indicator for U.S. stock markets, currently breaking out of a long term downtrend.
Our research Team analysed multiple charts, trends and correlations to provide our readers with a factual perspective on what’s is happening right now in the stock and Global markets. Our latest article, “Alert, Stock market Crash about to happen” tackled a crucial question and provided the following answers:
The research team of InvestingHaven does not think so. Although the researchers spent a lot of time solving this question, and have collected many charts to make this point, there is only a handful of charts that stand out. The one below is one of the key charts we have identified.
We also shared how we are using the YEN as a leading indicator and our rationale:
The Yen has correctly forecasted major stock market crashes in the last 4 decades when it did one of the two things. Either, it had been rising between 50 and 100 pct in one year prior to a mega crash (1987, 2000) and/or it broke secular resistance (2008).
But investors are right to watch what’s happening closely and so are we. The charts and indicators we have analysed point towards a Bullish scenario for the Stock market in general and Emerging markets in particular.
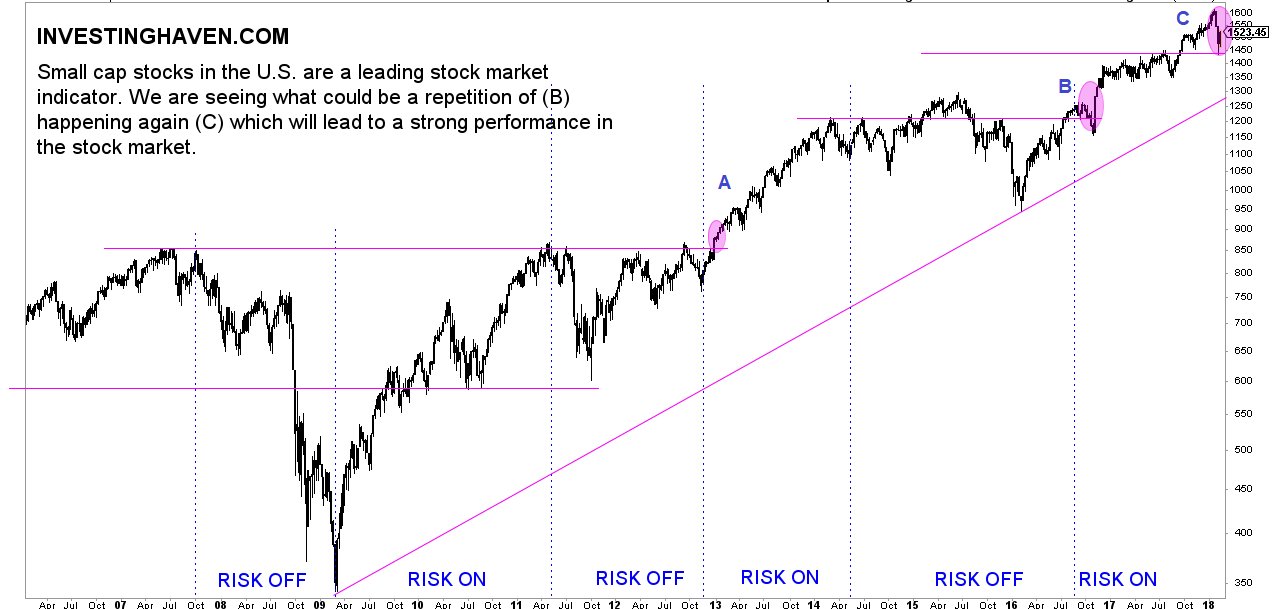
Another Chart pointing towards Risk on for investors
The small cap index, Russell 2000 (RUT), is a ‘risk asset’, and the recent move annotated in the chart below points towards a Bullish move. As long as the support holds, we have a confirmation that Russell 2000 retraced to test its breakout level and will continue on its upwards move, which has an important impact on both the US stock market and Global markets.