
Last week, we provided our readers with an update on our S&P 500 forecast (SPY) where we mentioned that the market correction didn’t happen in September / October 2017 but that doesn’t mean it won’t happen. We mentioned the following:
We still remain very suspicious, and though the timing of our forecast is way off, we still believe that a serious spike in volatility with a serious market correction as a result in still in the cards.
A month prior to the article above, Copper price (COPPER) was retracing and we published Copper Retracing. How Low Can The Price Of Copper Fall?
We believe copper has broken out of its long term bear market recently. At the end of July we got a confirmation of the copper price breakout. The start of a new bull market does not necessarily mean that things will go up in a straight line. The bull market can start off slowly similar to the pattern we now see on copper’s chart.
The question becomes: How can we expect a Bullish move in Copper and a US stock market correction? Isn’t there supposed to be a positive correlation between Copper price and the US economical strength?
What is InvestingHaven’s current outlook for Copper price? Still Bullish?
Above all, what do we expect based on intermarket analysis (the basis of our methodology).
These are the questions we will answer in our article today and we start with Copper price action.
Copper Price Action
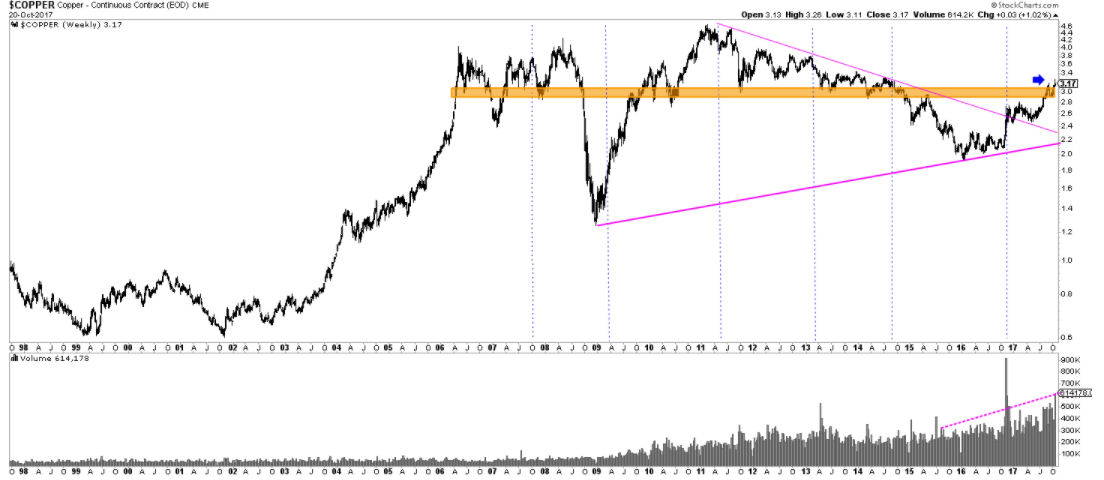
The chart below covers Copper’s price movement since 1998. It shows clearly the price breaking out of the triangle outlined in pink. It also shows the heavy resistance in the orange area.
Our latest copper price update covered this movement in details. Since then, Copper price started another upwards and is sitting around the 3.20 USD level. We still favor a Bullish scenario and maintain that 3.20 is the crucial level that Copper needs to cross for further upside.
By breaking above the pink trendline, Copper has emerged from a downtrend that dates back to 2011. But that’s not enough, as it is still in a resistance area that has been a support since 2006. So it is to be expected that breaking this resistance might take a few attempts, hence our comment above where we mention that Copper’s Bull market is not going to go up in a “straight” line.
The correlation between the Copper price, S&P 500 and Russell 2000
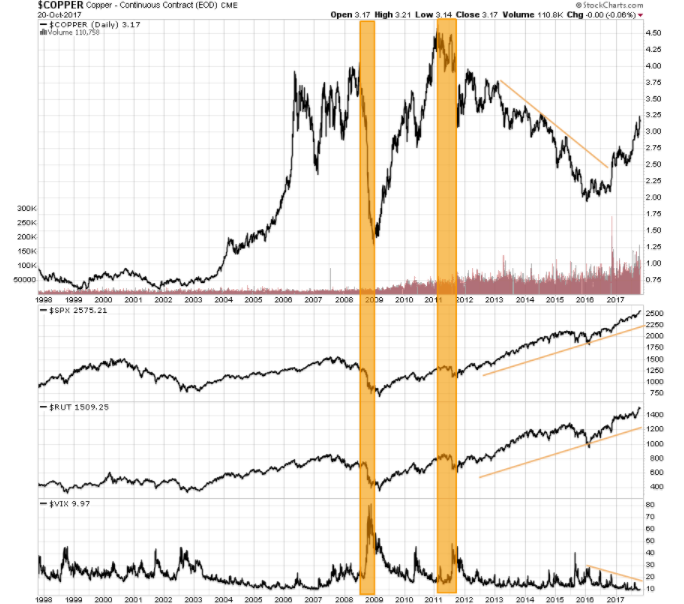
The chart below is a comparison of the price movement in Copper (top chart), next is S&P 500, followed by Russell 2000 (RUT) and last is the VIX.
The conclusions we draw from this comparison are the following:
- A bottom has formed for Copper price with a high probability for upside movement continuation.
- Copper price was in a downtrend since 2012. SPX and RUT in an uptrend for the same period. In fact, the positive correlation Copper / US Stock market was broken since 2012. Understandably, since less and less manufacturing is happening in the States. With most manufacturing moving to China, it makes more sense to look at the positive correlation in that direction.
As of 2011, Copper price seems to be positively correlated with the Chinese PMI. And with this. the answer to our question from earlier becomes pretty clear: Yes, we can expect a US stock market correction and still expect Copper price to continue on an upward trend. If there is a correction in the Chinese stock market, then that’s a different story and that would be rather bearish for Copper price.
We had shared earlier this year how we have a positive outlook for emerging markets in 2017 and 2018 and shared our Top 5 emerging markets to invest in. China is definitely in the count. As we can see, it all ties in.
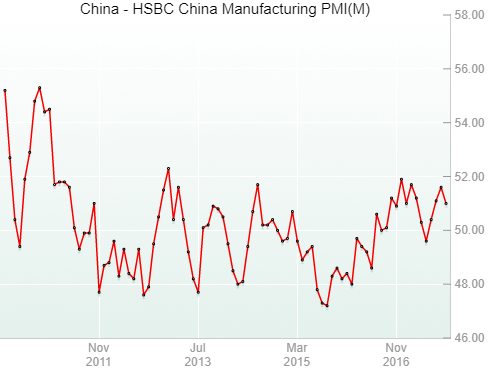
PMI Indicator source
Volatility in U.S. markets
The last component in our article today is the volatility level in the US markets. It is concerning and definitely out of the ordinary. The table below, shared by Ryan Detrick Senior Market Strategist at LPL Financial shows how the market volatility we are currently seeing is historically low. The only time we have seen this level was in 1965, and the only times it was lower was in 1963 and 1964.
Is it possible to see the market’s volatility go as low as a 6 or 3? Possible, yes, but the odds of a correction are much higher from what we can draw from our intermarket analysis.
The one factor that could contribute to delaying the US stock market correction though is something investors noted earlier this year: The Trump effect.
Since the election, the US stock market has been breaking records and we shared with our readers our favorite indicator to measure the strength and longevity of the Trump effect earlier this year. This indicator is the XLI/SPX chart indicating the performance of industrials in the US which actually has been on the move the last 2 weeks.
So should there be a delay in the US market correction, it could provide an added boost to Copper’s price.
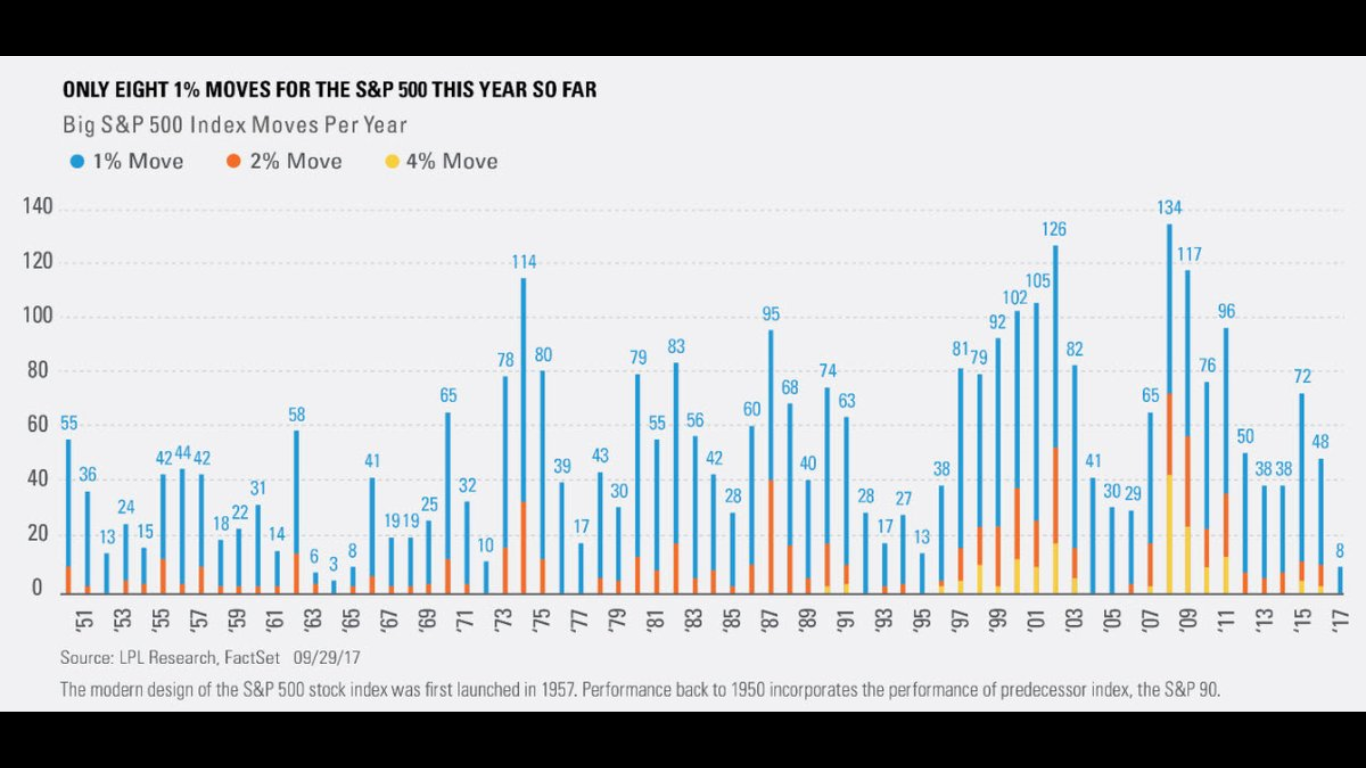
Table shared by Ryan Detrick Senior Market Strategist at LPL Financial


