Investing
Haven
No Result
View All Result
Forecasting Global Markets
  • Login
  • 2023 Forecasts
  • Stocks
  • Commodities
  • Silver
  • Lithium
  • Crypto
  • Top AI Stocks →
  • Top Silver Stocks →
  • TOP ENERGY STOCKS →
  • Top Lithium Stocks →
  • CRYPTO SELECTION →
Investing
Haven
  • 2023 Forecasts
  • Stocks
  • Commodities
  • Silver
  • Lithium
  • Crypto
No Result
View All Result
InvestingHaven
No Result
View All Result

Copper Price Confirmed Breakout Following Recent Retrace

by Taki Tsaklanos
October 06, 2017
in Breakout / Breakdown
0
Tags: COPPER
copper forecast
Share on FacebookShare on Twitter

Copper (COPPER) price started retracing 2 weeks ago after hitting a high of 3.20 USD. We covered the price action in our article Copper Retracing. How Low Can The Price Of Copper Fall? We said back then that we foresee 2 scenarios for copper:

  • Either it remains above $2.80 in which case it confirms its breakout and creates a new trading range (the 3d one in 2 years time)

  • Or it falls back in its previous trading range in which case the most likely path is that it will trade between $2.45 and $2.70.

We favored Scenario # 1 as we believe Copper broke out of its long term bear market. It looks like the price action during the last 2 weeks confirms this forecast. Here is why:

Copper price Broke out of its long term bear market

Copper price Weekly

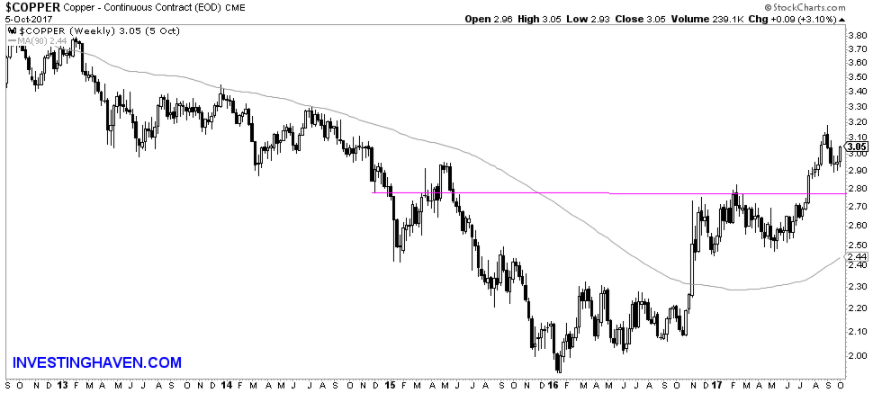
The chart above is Copper’s 5 years weekly chart. It clearly shows how 2.80 USD is the line in the sand. Copper price is Bullish above, back to trading in the 2.45 to 2.70 Range if it crosses below.

This view also illustrate how 2016 was the bottom in Copper price and that November 2016’s Copper price surge was the start of the reversal. Investinghaven covered this important price action in our article Copper price Surging, close to a secular Bull market. We encourage you to read it as the insight from that article from October 2016 is still valid today.

The price action from the last 2 weeks was a successful backtest for Copper price confirming the breakout.

What’s next for Copper price

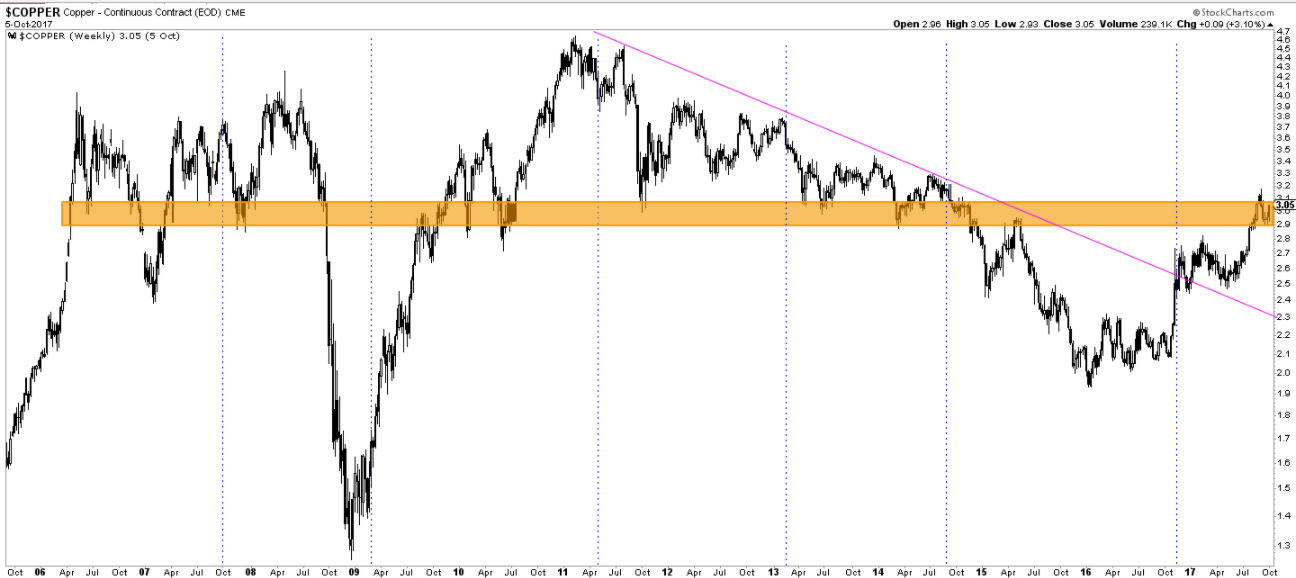
Our next chart covers Copper price for the last 11 years. This view also shows how copper price hit bottom in 2016.  We also see how the price is at a resistance area that has served as a strong price support over a significant period of time with the last period being between 2011 to 2014. The orange line marks this resistance area and that’s where Copper price is moving right now.

So the answer to what’s next is 2 possibilities:

  • A break above the 2.9 to 3.1 USD resistance area could signal a sharp movement upward for Copper. We can possibly see Copper price moving in a 2.9  to 3.1 USD sideways price action prior.
  • A break below 2.8 could lead to the price falling back in the previous 2.45 to 2.70 range. This scenario is less likely.

Overall, Copper looks bullish right now though we want to see 3.20 clear anytime soon. If that does not happen it can be a double top which would be concerning.

Copper price 11 years

Receive our weekly newsletter.

*We hate spam as you do.

premium service trade alerts   premium service trade alerts   premium service crypto teaser  
WARNING: InvestingHaven.com, our site, is not affiliated and has no connection whatsoever with Invest Haven Group on Invest-Haven.com or Investing-Haven.com. InvestingHaven.com did not have and will never have sales reps. Do not accept financial offers, certainly not by telephone, this is why >>
Taki Tsaklanos

Taki Tsaklanos

Taki has +15 years of experience in global markets. His methodology is unique and effective, yet easy to understand; it is based on chart analysis combined with intermarket / fundamental / sentiment analysis. His work appeared on major financial outlets like FinancialSense, MarketWatch, ... Email: taki.tsaklanos@gmail.com. Twitter: twitter.com/investinghaven

Latest

stocks forecast

How To Know When The S&P 500 Confirms A Bullish Turning Point?

September 28, 2023
cryptocurrency forecast prediction

The Most Bullish Cryptocurrency Chart Setup Of October 2023

September 28, 2023
leading indicators

Will The S&P 500 Find Support At Its 200 Day Moving Average?

September 24, 2023
uranium stocks

Is The Breakout In The Uranium Market Confirmed?

September 24, 2023

Connect with InvestingHaven

Receive top notch forecasts for free.

*We hate spam as you do.

Categories

  • 2023 Forecasts
  • Stocks
  • Commodities
  • Silver
  • Lithium
  • Crypto

Site Navigation

  • RSS Feed
  • About us
  • Mission 2026
  • Sitemap
  • Privacy & Disclaimer
  • Terms of Service
  • InvestingHaven vs. Invest-Haven
  • Contact Us
Investing
Haven

Top notch forecasting with gold price forecast, many stock predictions, cryptocurrency charts. Many investing tips and crypto market analysis.

Copyright © 2023 InvestingHaven

No Result
View All Result
  • 2023 Forecasts
  • Stock market
  • AI Stocks
  • Alternative Energy
  • Lithium Articles
  • Lithium Stocks
  • Silver Articles
  • Silver Stocks
  • Crypto Articles
  • Premium Crypto Research
  • Premium Services & MyAccount

Copyright © 2023 InvestingHaven

Login to your account below

Forgotten Password?

Fill the forms bellow to register

All fields are required. Log In

Retrieve your password

Please enter your username or email address to reset your password.

Log In

    InvestingHaven.com honours your privacy. Read our Privacy Policy