What a difference a week or two can make in markets. The sentiment early August was overly bullish, right at a time when volatility hit historic lows (never seen before as long as VIX is trading). Most leading stock indexes hit another all-time high on August 8th. Two weeks later, we start seeing a very eventful lower low on the hourly chart of the S&P 500 (SPY). That is not good news, as it happens mid-August, right at the start of the weakest season of the year.
Earlier this week we published our S&P 500 forecast for October 2017. We said that the coming correction could, worst case, dip in the 2000 to 2100 area, taking into account that exhaustion selling mostly prints a meaningful (though temporary) dip. As we got several reader questions about this forecast, we decided to finetune our forecast. Also, some readers are asking if this is the Is this the 2017 stock market crash, which we don’t think it is as our price target is more of a healthy correction rather than a crash.
The coming stock market correction
To the best of our knowledge a stock market correction is coming. We have seen several signs which point to the same outcome: a short to medium term stock market correction, one of them being volatility indicators.
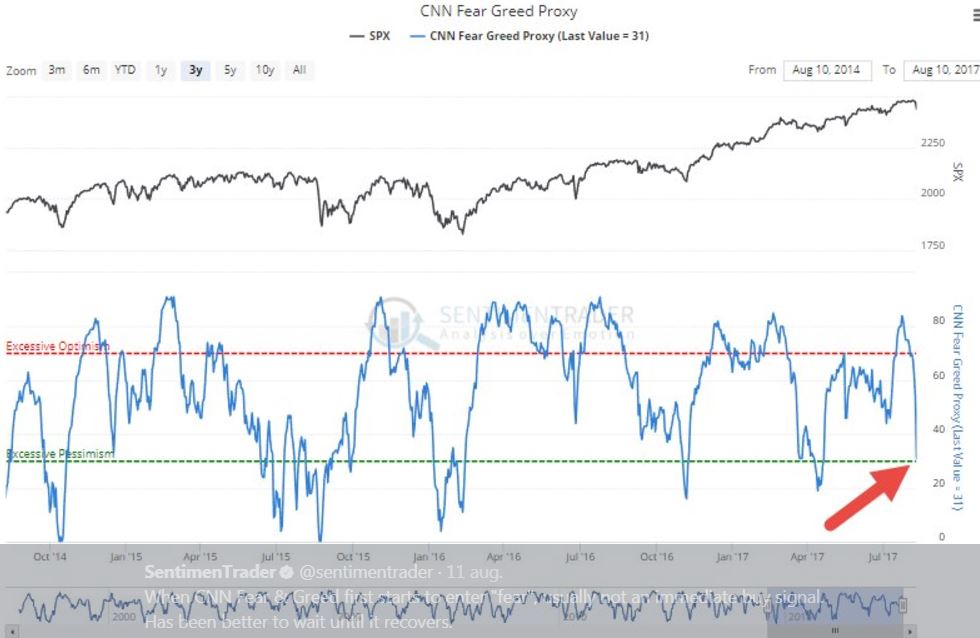
Along the same lines, we see another worrisome sign, even it is more anecdotal evidence in nature. The CNN fear & greed index, though not an exact indicator, is confirming what many other indicators are signaling: a short to medium term correction is ahead. This indicator has dipped many times in ‘excessive pessimism’ territory, and mostly it stayed there for a short period of time (a couple of weeks or, ultimately, a couple of months). Courtesy of Sentimentrader.com.
Our S&P 500 correction forecast is 2125 points
In our previous forecast update we wrote “It is fair to say that the most bearish scenario will bring the S&P 500 down towards the 2100 area, it could even dip towards 2000 points.”
Are we saying that the S&P 500 * will * go to 2000 points? That is certainly not what we are forecasting. Our point is that the most bearish scenario * could * bring the index down significantly, it could even dip in that larger support range, which would be a correction of 13 to 18 percent. So our most bearish S&P 500 forecast for 2017 (October to November time period) is approximately 2050 points, some 15 percent from today’s levels.
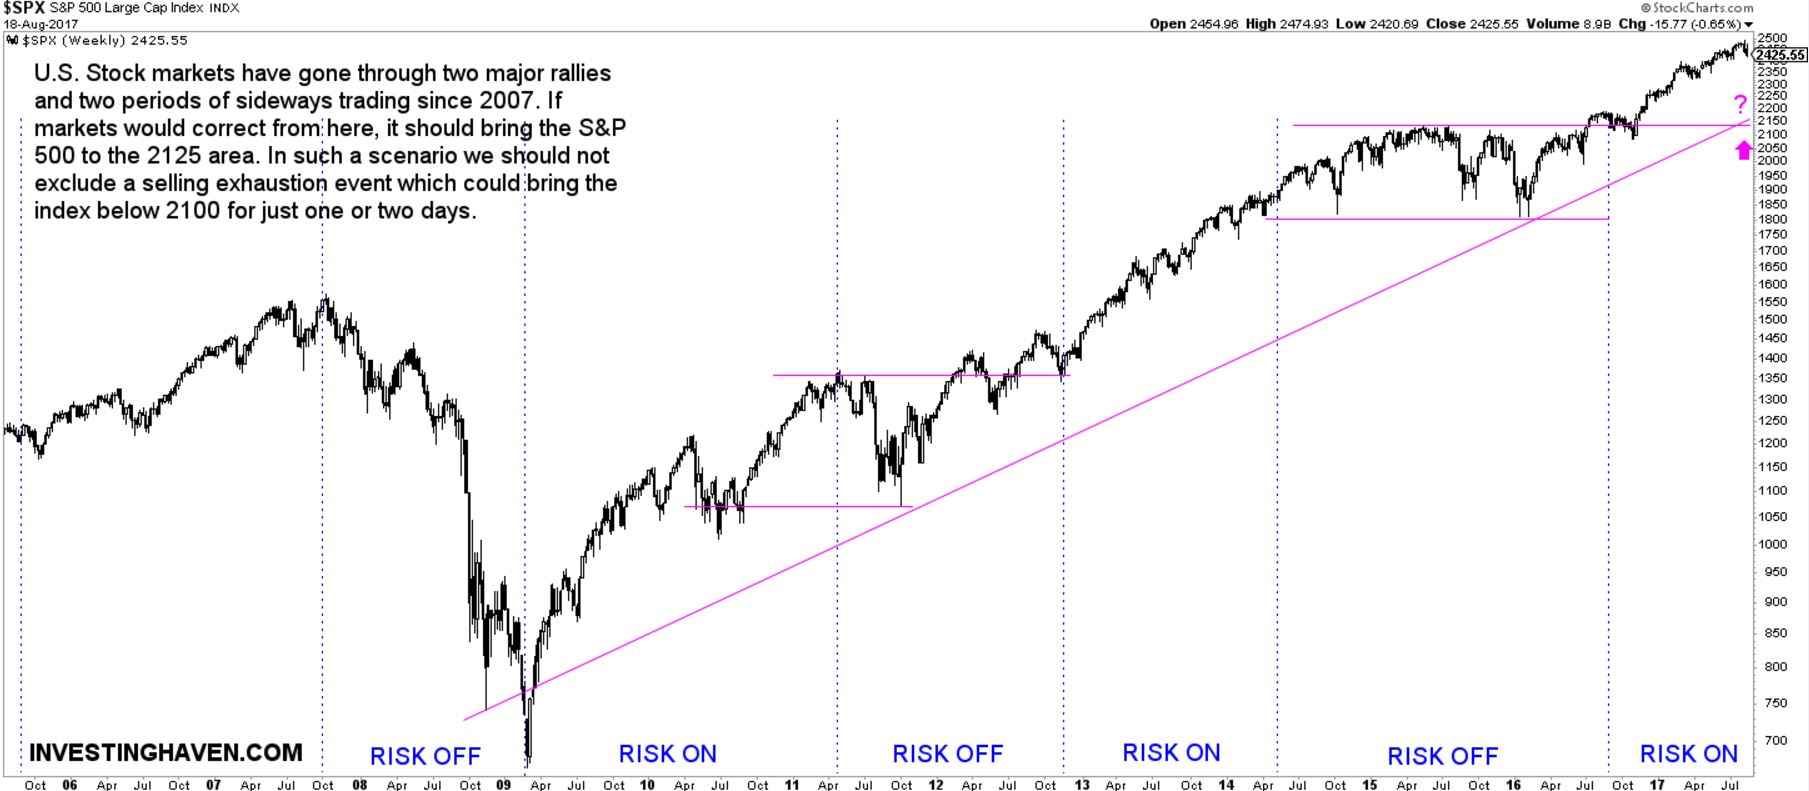
The long term chart which we rely on for our forecast points to 2125 points as the target. That is because it combines two very powerful trendlines. On the one hand it is the resistance trendline of the “risk off” period in 2014 to 2016. On the other hand there is this rising trendline which connects the mega-dips since 2008. They meet at 2125 points.
We believe exhaustion selling could take place with a dip in the 2000 to 2100 area for just a couple of days.
With this weeks’ lower low we believe the correction towards the 2125 points in the S&P 500 has started.