
The silver chart may look ‘boring’ on the daily timeframe. However, the long term silver chart has a hugely important silver chart trendline for silver investors in 2024.
Related – When Exactly Will The Price Of Silver Start A Rally To $50?
This silver article features both intermarket analysis and chart analysis, not to be confused with technical analysis.
Our silver analysis methodology is explained in great detail in our detailed silver prediction. We focus on silver’s leading indicators, and combine it classic silver chart analysis.
Exceptionally, we do not cover silver fundamentals in this article. While there is enough evidence of a silver shortage, with supporting evidence in the latest SLV data (source Ed Steer), we focus on the silver price chart. In the end, it is the chart that visualizes decisions of buyers and sellers, collectively.
#Silver cumulative deficits of 2021, 2022 and 2023 = 474Moz, nearly 50% of 2023 total supply. Projected deficit by 2030: 120% ! pic.twitter.com/ZwRKhYAvKA
— Peter Krauth (@peter_krauth) December 20, 2023
Will a turnaround in the Yen lead silver higher in 2024
The turnaround in the Yen has been the big topic of the past week.
We would argue that a new uptrend in the Yen (if/when confirmed) has the potential to become THE single most important topic of the first half of 2024.
Especially precious metals investors should be very interested in what the Yen does, going forward, as it might be the ultimate leading indicator to lead gold (more so silver) higher.
As explained in gold & silver higher on a Yen turnaround:
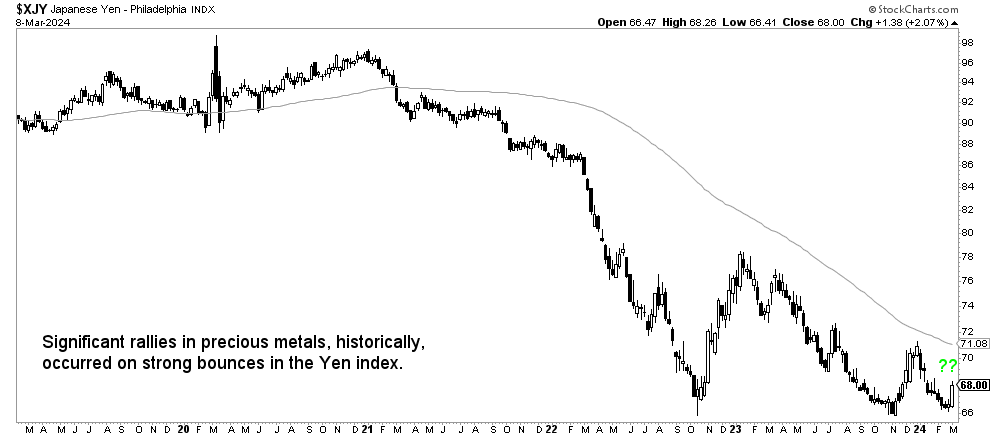
Intermarket dynamics 101 – the Yen declined significantly since February 2022, and so did the price of gold. On every spike in the Yen, for instance in Nov of 2022 and Nov of 2023, gold followed suit. While the correlation may not materialize on a day by day basis, it certainly is visible on the longer term timeframe, weekly chart below.
Below is the 5-year Yen chart – a significant bounce, well above the long term moving average, will likely push gold higher and silver much (much) higher.
Silver investors better pay attention. We would complement this Yen chart with the silver price chart, particularly the silver chart trendline we’ll show in the last chart in this article.
The silver price chart 2024 – boring, so far at least
What’s interesting is that the Yen trend change (pending validation by the market) has the potential heavily affect the silver price, in a positive way.
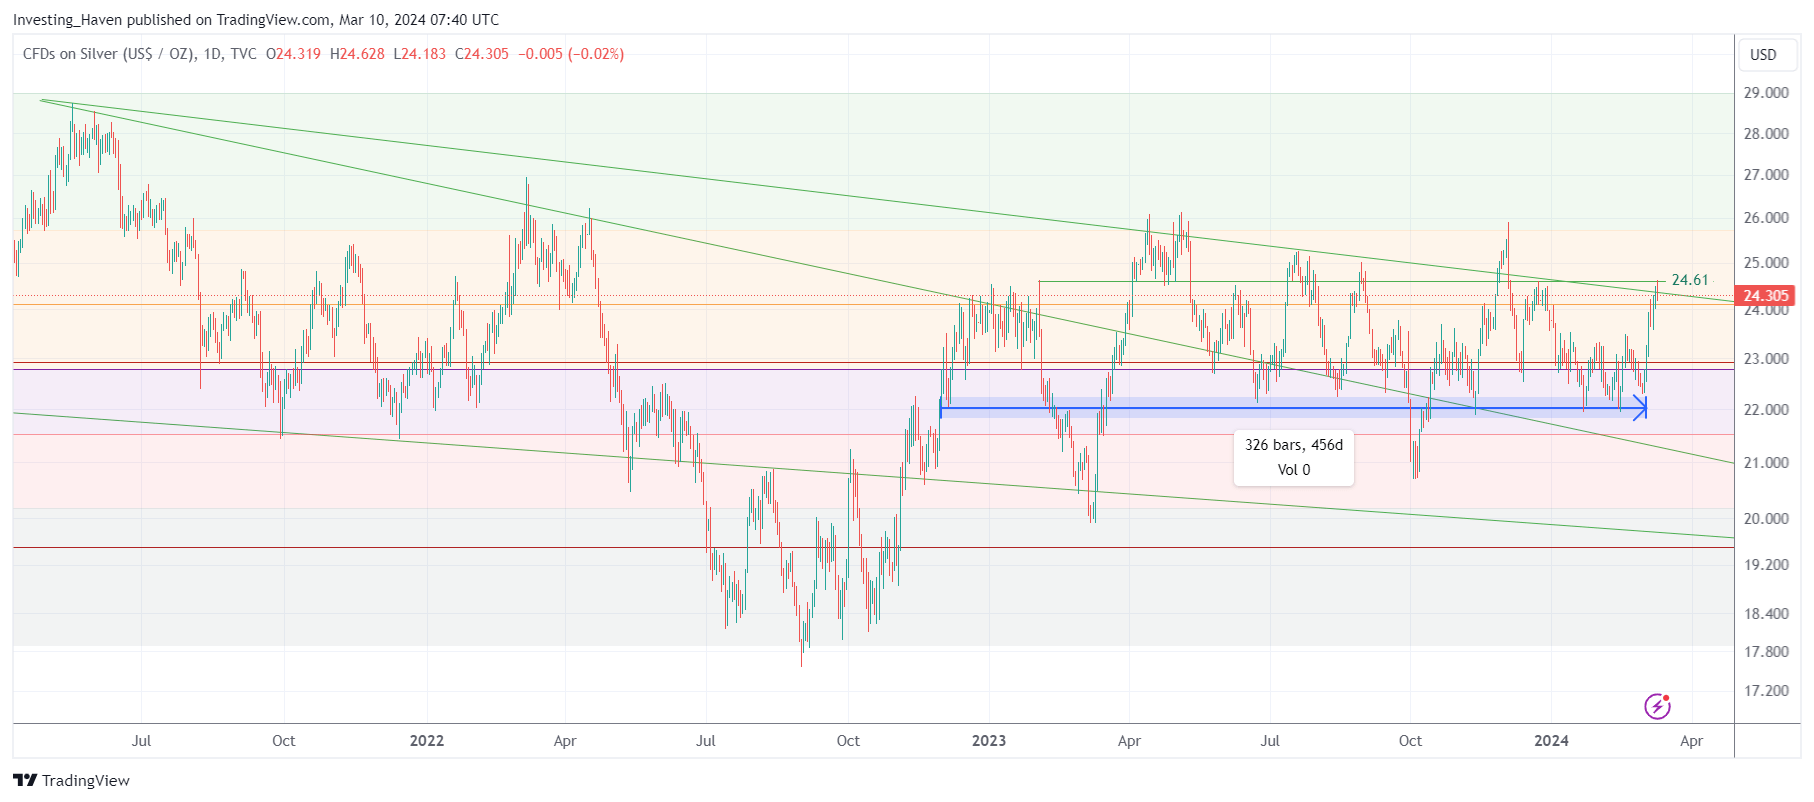
The daily silver price chart, while ‘boring’, has a lot of valuable information to offer:
- The price of silver is above its bullish level, i.e. the 50% retracement level (fine purple line on our chart).
- Silver is now ‘testing’ the falling silver chart trendline which originates from the top set in April of 2022.
- Silver, in a way, is now ‘sandwiched’ between a bullish level (horizontal chart structure) and a the last bearish hurdle (diagonal chart structure).
It will be really interesting, and critical from an investment perspective, to watch if a continued rise in the Yen will push silver higher. If so, silver will be in strong bullish territory, ready to attack the highs of the 3-year consolidation.
While we mentioned the 3-year silver chart trendline, it is not THE single most important silver chart trendline.
The most important silver chart trendline of 2024
By far, THE single most important silver chart trendline is the one on silver’s long term chart.
A picture is worth a thousand words.
A silver price chart, with proper and accurate annotations, is worth more than a thousand words.
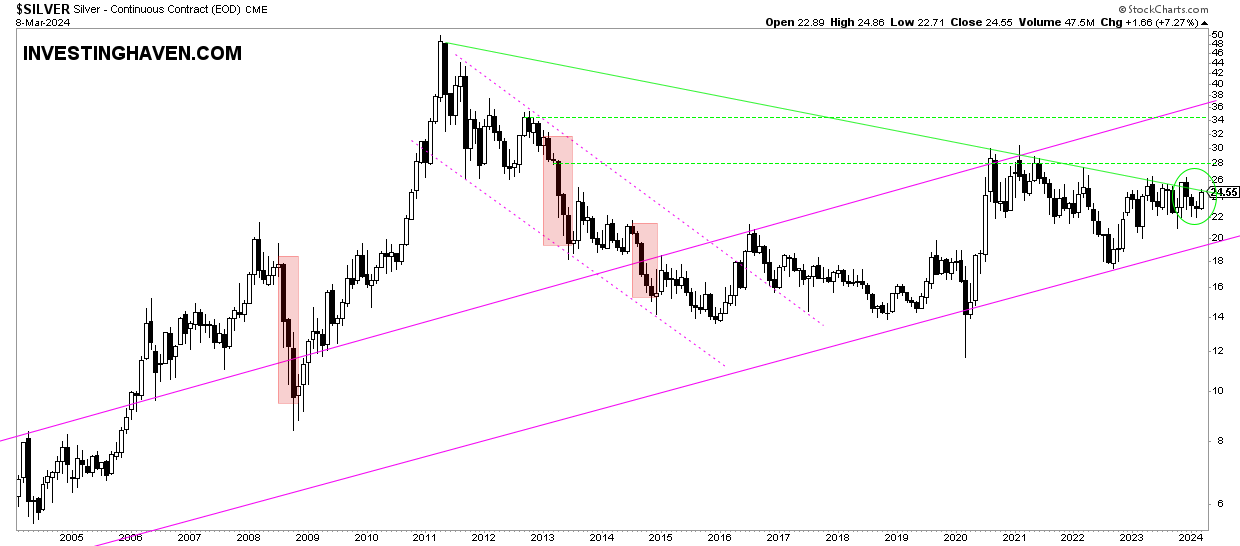
Below is the 20-year silver price chart, with basic annotations reflecting long term silver price trends. This is no voodoo nor is it technical analysis. It is plain and simple chart analysis.
What stands out from this long term silver chart:
- The long term rising trend (purple rising trendline from left bottom to right center). In simple terms: silver is a long term uptrend.
- The big test that is currently ongoing – the most important silver chart trendline which connects the highs of 2011 with the highs of 2020, 2021, 2022, is being tested, once again, at the time of writing.
It goes without saying – a move higher in the price of silver will create an epic breakout on the silver price chart. Rest re-assured, many non silver investors are tracking this chart, they will receive a strong buy alert once this happens.
As the silver market is a relatively small market, it requires a bit of capital inflow from non silver investors to trigger a big move in the price of silver.
Silver chart trendlines – only watch the dominant ones
Again, trendline analysis is unrelated to technical analysis.
Similarly, not all trendlines are not equally important.
The silver chart is full of spikes and swings. That’s because of the volatile nature of silver. This implies that many trendlines may appear on a silver chart. However, that’s a problem – only dominant silver chart trendlines should be considered as part of silver price analysis.
The general rule of thumb – the longer the trendline, the more dominant.
That’s why we cannot emphasize enough the importance of the silver chart trendline. A move higher, above this 12-year trendline, will unleash tremendous bullish energy.
Read more detailed silver analysis in our latest premium precious metals update (log in required): Silver Continues To Exhibit The Most Bullish Leading Indicators + Unique Gold & Silver Mining Charts.


