During today’s trading session, 2-year Treasury Yields briefly went to 5.12 pct after which they came down and closed the session below 5 pct. On March 7th, 2023, 2-year Yields set an intraday and multi-year high at 5.08 pct. Could 2-year Yields be working on a giant double top pattern? The answer to this question is crucial for silver investors because of the inverse correlation between yields and the price of silver. For analysts like ourselves, it is crucial to track those correlations because we are very bullish silver as per our detailed silver forecast and believers in the secular silver breakout that occurred in the first week of April.
In the most recent weekend edition of Momentum Investing, we looked at a diversity of data points directly or indirectly influencing the silver market. All details are laid out in this alert, available in the restricted research area: Silver Conditions Can’t Get More Bullish Than This.
Silver’s leading indicators are strongly bullish, silver price charts are very bullish provided current levels hold on a 5 day closing basis), the futures market is strongly bullish, the physical market is experiencing a supply deficit.
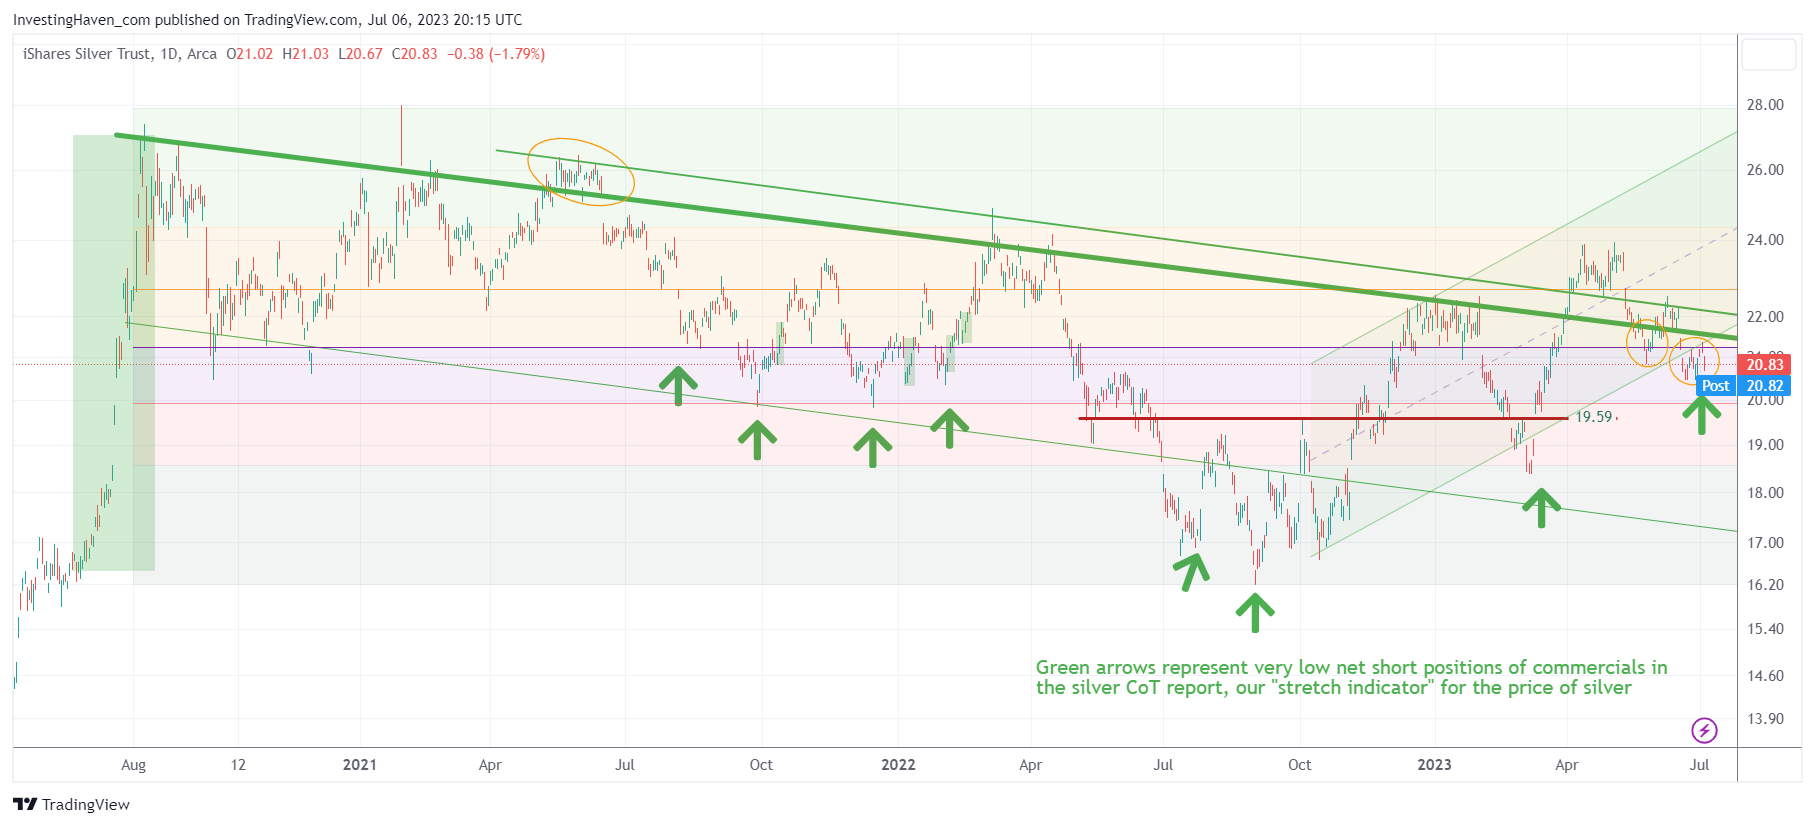
One of the charts that we have featured often in the public space is the SLV ETF (several other charts are reserved for premium members of the Momentum Investing service). The SLV ETF, with our annotations, is embedded below. This quote is the short commentary that we copied from our most recent silver alert (we had much more detail to all other leading indicators & silver charts):
The SLV ETF chart shows a giant bullish flag. Note that we added another green arrow on this chart. Moreover, it looks like silver ended its pullback right at the 50% retracement level.
Readers should pay special attention to what we would call the ‘congestion area’. That’s an area loaded with lots of tension because that’s where multiple patterns and trendlines coincide. In the case of silver, we see that current price levels coincide with the crucial 50% retracement level of a multi-year consolidation structure, a multi-year falling trendline, a 9-month rising trend channel. Though not visible on this chart, there is also a very important significance of this current level on the multi-decade chart.
We do realize that investors are asking the question: “When oh when will silver finally start the long awaited bull run.” We would prefer to re-phrase the question: “How long does it take for a market to deal with an area of tension that is a confluence of multi-year and multi-decade chart structures?”
The point is this: silver is the restless metal. This means that, whenever silver bulls decide to take over control, the rise will be spectacular. The waiting will be rewarded.
While it is true that the big silver bull run is long overdue, it is also true that a longer consolidation will result in more power.
We continue to believe that silver is ready to start an epic bull run. It might start when 2-year Yields are confirming a topping pattern which might be any moment. If 2-year Yields have more upside potential, patience of silver investors might be tested for a little longer.
For our Momentum Investing members, we created an overview of our top silver stock selection: Selection of Top Silvers Stocks For Long Term Portfolios >>