
We have covered silver and junior silver miners extensively in recent months: silver’s giant bullish flag, the triple bullish signal in silver junior miners, the silver supply deficit of 2023, our silver price forecast 2023. In today’s article, we’ll reveal a secret on how we read the silver junior mining chart and why we are so extremely bullish on silver junior miners. Note that these chart readings are extensively covered in our Momentum Investing analysis, we only occasionally make something public about our premium services.
The chart displays the price movement of the ETF Global X Silver Miners (SILJ) over the past year. The chart reveals the presence of multiple chart patterns that have emerged and interacted with price action during this time.
Firstly, a bullish triangle pattern emerged from May 2021 till today, where the price movement was initially mostly sideways, followed by a breakdown in May 2022.
However, in October 2022, the price broke above the resistance line of the descending triangle pattern, indicating a potential reversal of the previous downtrend. The price continued to move higher and formed an ascending triangle pattern, with a horizontal resistance line and higher lows.
In February 2023, the price broke above the resistance line of the ascending triangle pattern, indicating a bullish breakout. The price continued to rise and reached a high in early April before encountering some selling pressure. Here it becomes interesting but also very important: the exact resistance level is 11.80 points which coincides with the 50% retracement level of the area that was created top to bottom (since 2021).
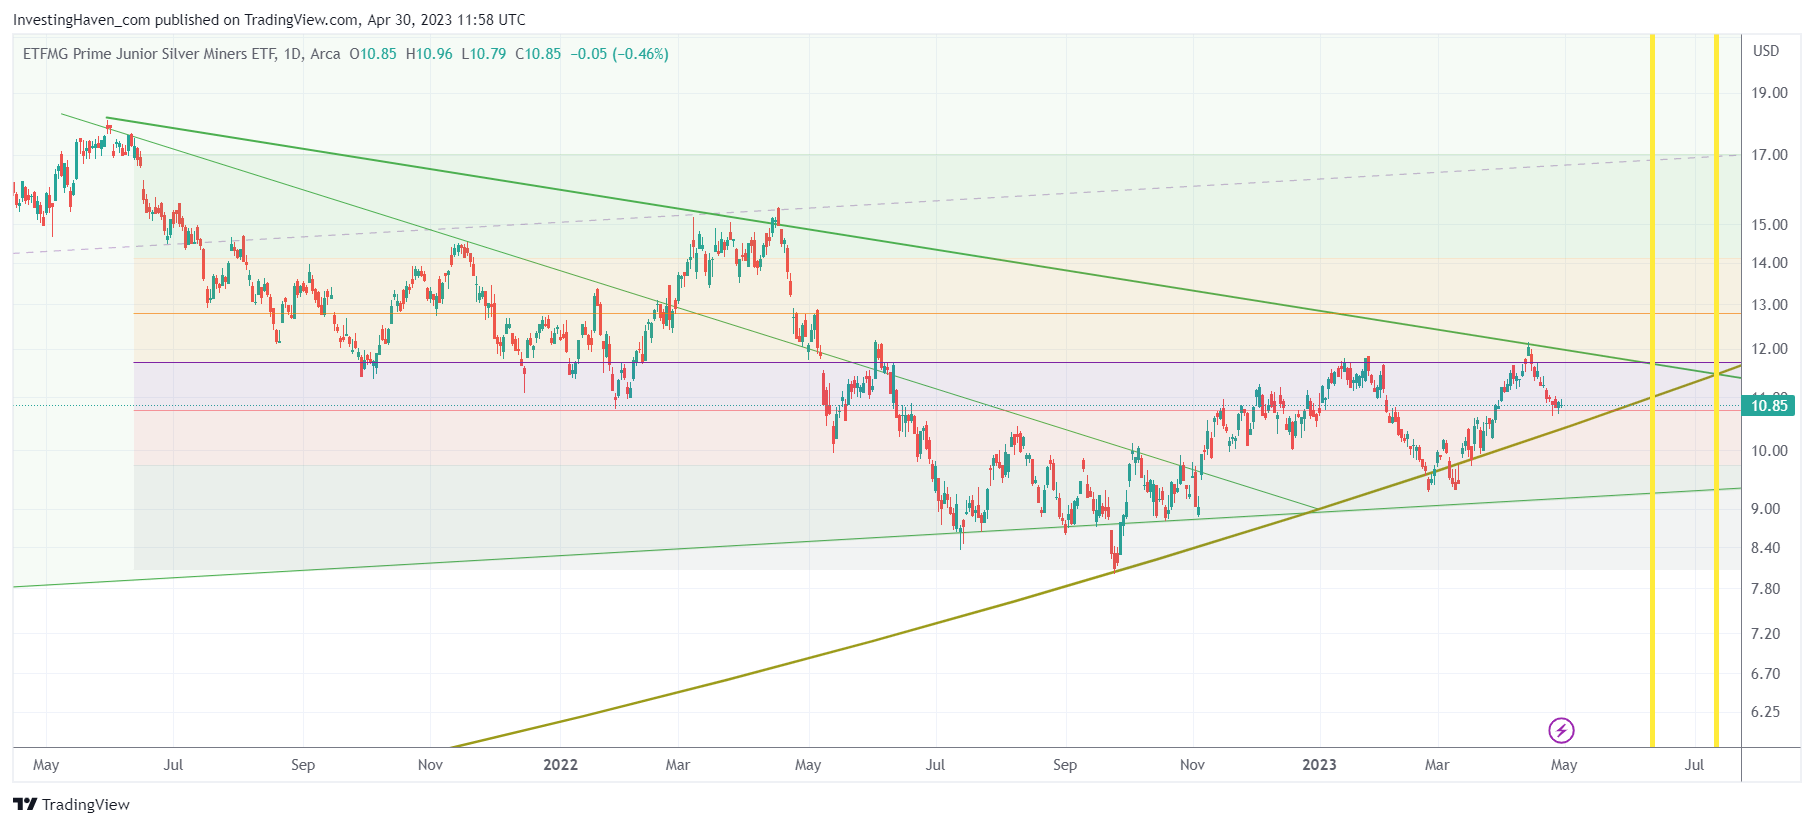
What’s equally important, is that there are 3 distinct chart patterns: horizontal levels (with different colors), the rising/falling trendlines, the 10 year rounded structure (gold rounded line). Those 3 structures give us a time window in which a resolution will take place, see the yellow lines.
Overall, the chart suggests that the price of SILJ has been in a downtrend for a while, but the recent breakouts from the descending and ascending triangle patterns, as well as the double bottom pattern, suggest that the price may be reversing its previous trend and entering a new bullish phase. A new bullish trend will be confirmed once the 50% level is cleared, at 11.80 points.
For our Momentum Investing members, we created a selection of top silver miners:
Top Silvers Stocks For Long Term Portfolios >>


