
Bitcoin’s chart can be both fascinating and a bit nerve-wracking for crypto investors, certainly those that joined the crypto space recently. In this article, we take a closer look at the BTC chart which is on the verge of a breakdown, we explain our viewpoint on a breakdown which might occur the coming days.
Update on January 22nd, 2024: We updated the Bitcoin chart, there are more annotations on the chart. We made Bitcoin’s chart self-explanatory. It is a must-see Bitcoin chart which should readers assess the breakdown assuming it can happen any moment now.
Why Bitcoin?
It is such an interesting question that we often receive from readers: “Why focus on Bitcoin, it has no intrinsic value?”
Interestingly, when the price of Bitcoin was going through the roof, back in 2017 and 2020, nobody was asking us this question. The dominant question, back then, was: “Which altcoins to buy, now?”
See related – Crypto Markets Almost Ready For Alt Season 2024. Are You?
In the end, investor sentiment is always driven by price. And so is their perception of value.
Our mid to long term Bitcoin forecasts
We can very brief about our crypto forecasts, particularly Bitcoin forecasts:
Are we bullish Bitcoin in 2024? Yes, we are:
We forecast that Bitcoin will exceed $60,000 USD in 2024, testing the area $66,000 to $69,000.
Do we expect that Bitcoin will go to $100,000? Yes, we believe so, not yet in 2024 though:
Bitcoin has the ability to rise beyond $100,000 in 2025 or 2026 after the ongoing multi-year W-reversal structure will be complete.
Short term, Bitcoin is very vulnerable
Cryptocurrencies, led by Bitcoin, have been on a wild ride in recent years.
While 2023 was great for Bitcoin, it was not for all cryptocurrencies. On the other hand, some did strongly outperform Bitcoin, particularly the ones we tipped in our premium service throughout 2023 (please don’t buy them now, they show signs of buying exhaustion): Fetch.ai rose 800% since we tipped it, Optimism 300% after we flashed a strong buy, Thorchain 600%, and so on and so forth.
Overall, The Bitcoin chart shows us the ups and downs, reflecting the rollercoaster-like nature of this market.
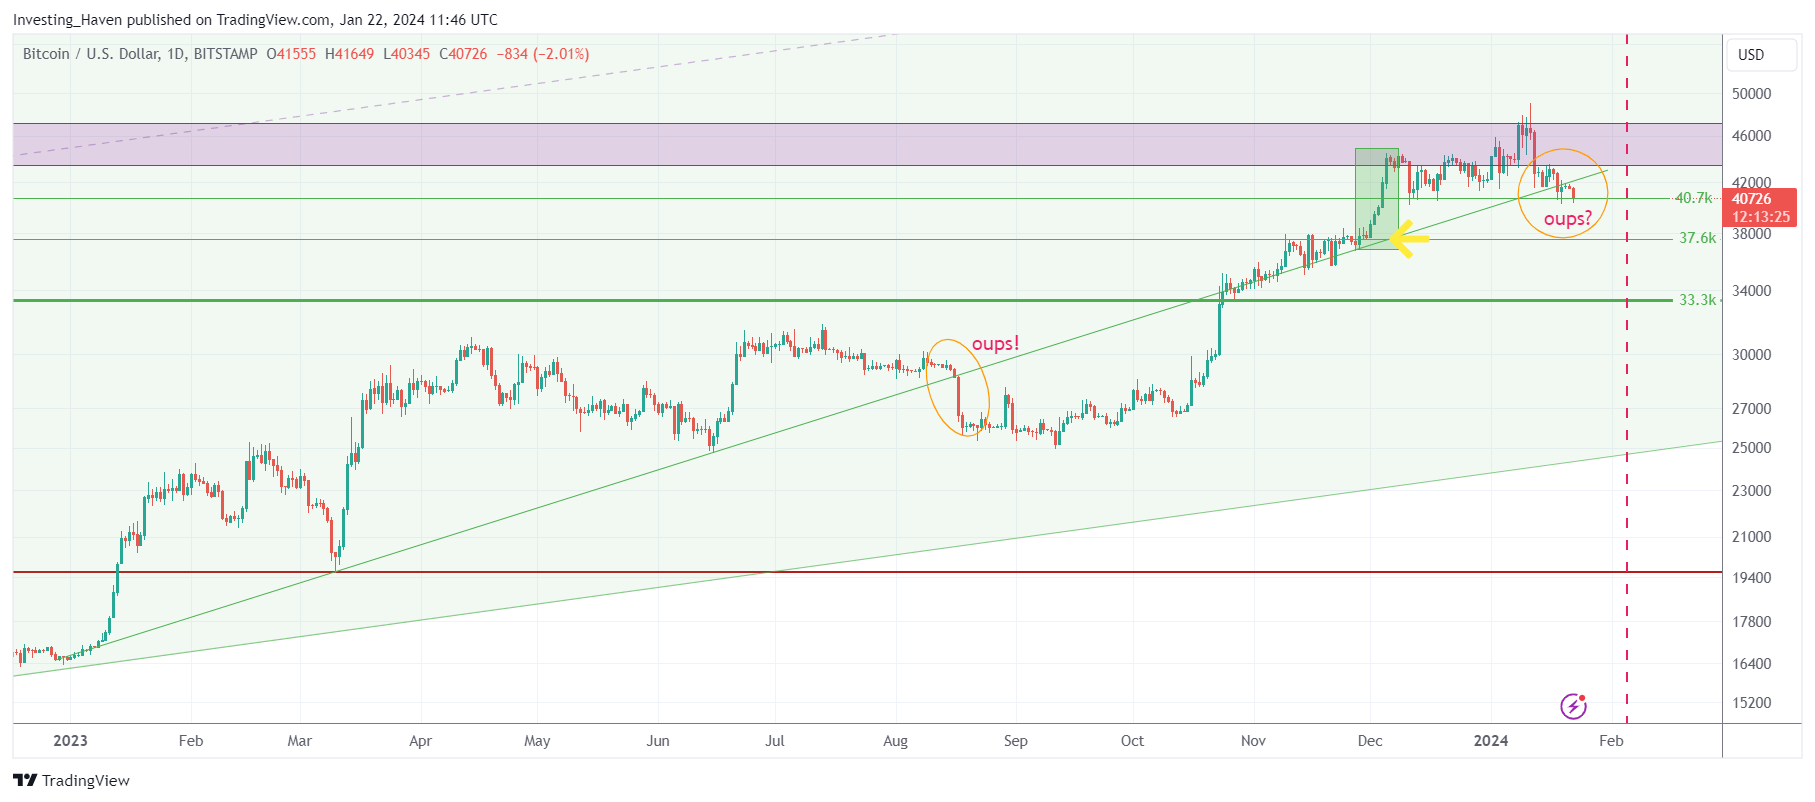
Update on January 22nd, 2024: We can clearly see that a drop in Bitcoin is imminent. On the flipside, in case Bitcoin recovers and respects 40.7k on a 3-day closing basis, it would be outstanding news. A drop, similar to the one in August, is not unlikely. We expect the drop to be short-lived, and we expect a few specific tokens to bounce strongly right after. That’s because crypto in 2024 is an hidden bull market.
BTC Chart Insight #1: A 20-month journey needs a rest
Our story begins in April 2022, a time when the entire crypto market, including BTC, went through some significant ups and downs. This was when we saw a decline in the 44-48k range. As we follow the pattern, it becomes clear that 48k is a big barrier. The completion of this pattern at 48k suggests that breaking through this level won’t happen overnight; it’ll likely take a few weeks.
The BTC ETF hype turned out to be a ‘buy the rumor, sell the news’ type event.
BTC Chart Insight #2: from not-so-great to not-so-bad
Now, the drama moves from a challenging point to a more supportive one. The support level isn’t just randomly chosen; it lines up with where the big drop started, hanging around 37.6k. While the current support is about 40.7k, the real concern is if it drops below 37.6k. A drop of less than 10%, which could happen in the next few weeks, adds an element of uncertainty to the market.
BTC Chart Insight Insight #3: The real challenge is 37.6k
As we explore the chart, the real challenge is getting past 48k. It has proven to be a tough nut to crack. But now, with a newly identified support at 37.6k, Bitcoin is in a good position. This support not only shields it from major drops but also sets the stage for an attempt to break through the 48k barrier. It might take a bit more time, but the strengthened support level is a key player in this story.
The really important level to watch, in case BTC would break below 40.7k (which seems highly likely), is 37.6k. The area 33.3k – 37.6k must hold in order avoid a new bear market.
Stated differently, we will not be concerned until and unless 37.6k is breached (to the downside). Then again, the support area 33.3k-37.6k is the really important area that must hold in the coming weeks and months.
Making Sense of Crypto Charts
As we wrap up this chart exploration, the cryptocurrency world, as seen in the BTC chart, remains full of potential twists and turns. Investors, while excited about the completed pattern, also need to grapple with uncertainties tied to support levels and potential drops. The journey from a tough spot to a more supportive one is a careful dance that calls for attention.
Crypto charts are like a map for investors. The Bitcoin chart we’ve looked at today tells a story of market dynamics, offering insights that go beyond the surface-level ups and downs. Navigating this landscape requires a good understanding of charts, resistance, and support levels. As the crypto market keeps changing, investors must stay tuned to these details to make smart decisions in a world that’s always moving.
In case 37.6k on Bitcoin’s chart holds strong, we believe we have amazing crypto tips for you in our premium crypto charting service >>
PREMIUM SERVICE TIP – This Cryptocurrency Can Rise 5x, Up to 8x, Provided ‘Narrative Effect’ Kicks In.