
Volatility indexes are a pressure cooker. In our terms, wildly bullish, but that’s wildly bearish for stocks. Given the position of leading indicators like yields/ treasuries and the dramatic USD rejection we tend to think think that we are near peak selling. A capitulation, maybe even a flash crash, is what these charts are telling us. Eventually, this might be the one or one but last wave of selling before new bullish trends will start. The question is which trends, which sectors, what to buy and what to stay away from. In our 2022 forecasts we have been focusing on tangible markets like lithium, cobalt, graphite, silver, gold. We continue to believe that they will outperform just because they are either in big uptrends (green battery metals) or in big basing patterns that are close to read to start trending (precious metals, also copper).
Let’s be clear: it’s not because we think a flash crash can happen that it for sure it will happen.
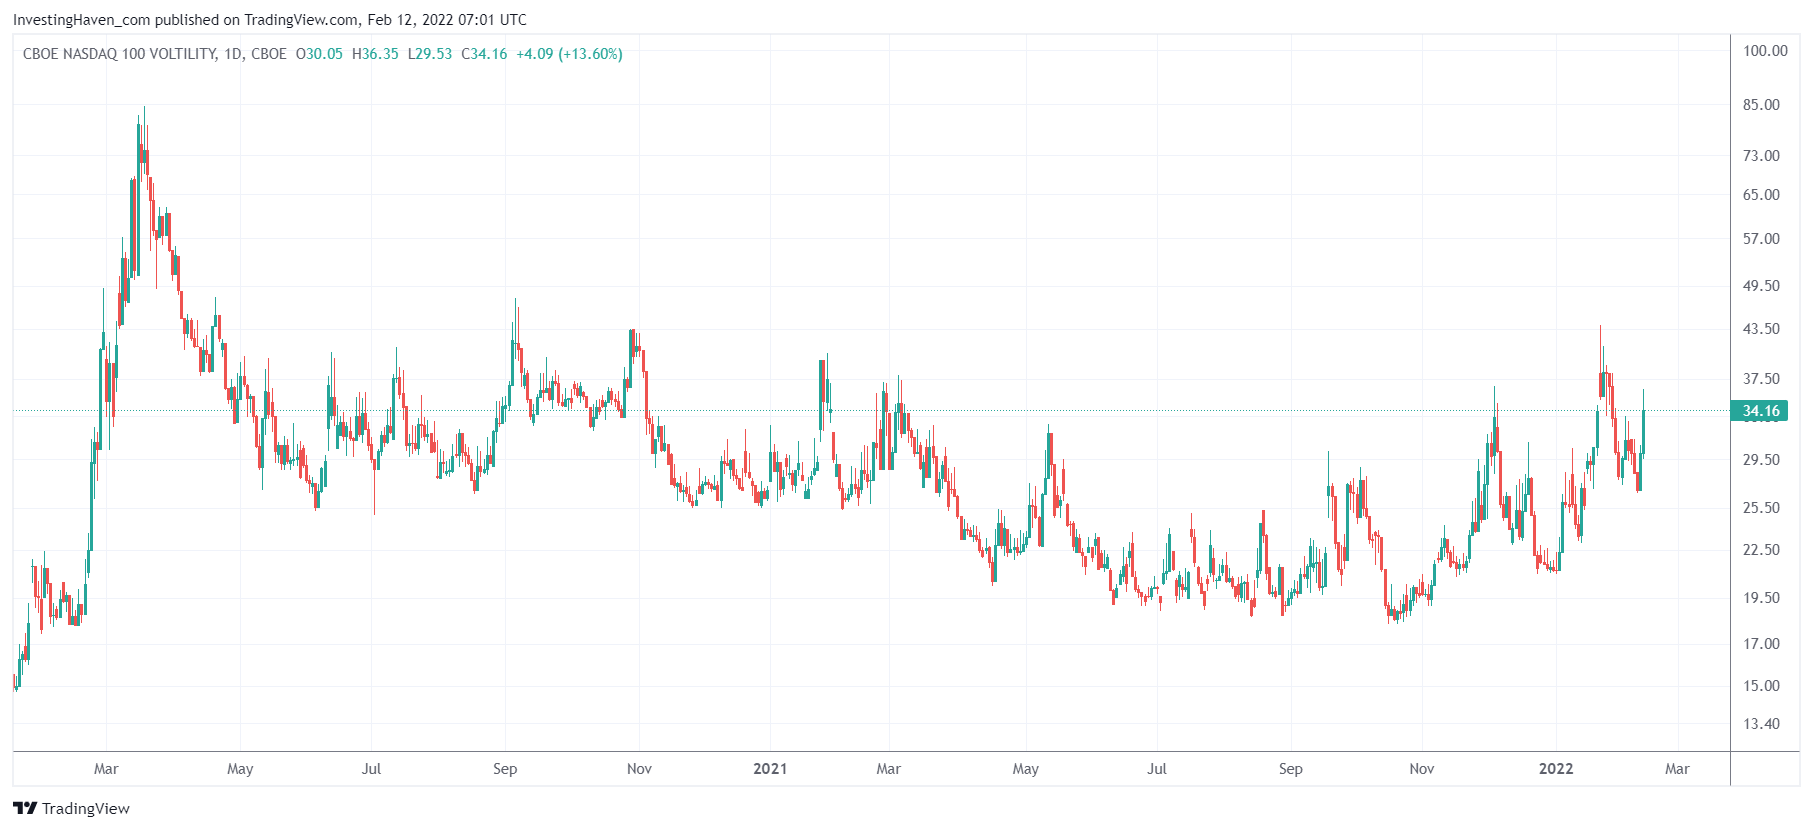
All we do is read the charts, the profile of the market, conditions and other leading indicator data points. All combined, we see selling acceleration especially on the volatility index charts. This is more outspoken in the weaker segments, which is why the volatility index of the Nasdaq shown below is by far the most aggressive volatility index (there are several variants).
What do you see on this chart? An acceleration in the bullish reversal. Bullish volatility is bearish stocks.
One last wave of selling, or two more? We cannot know, it will depend on how high this volatility index will go and if it eventually will come down hard enough to break the long term bullish setup.
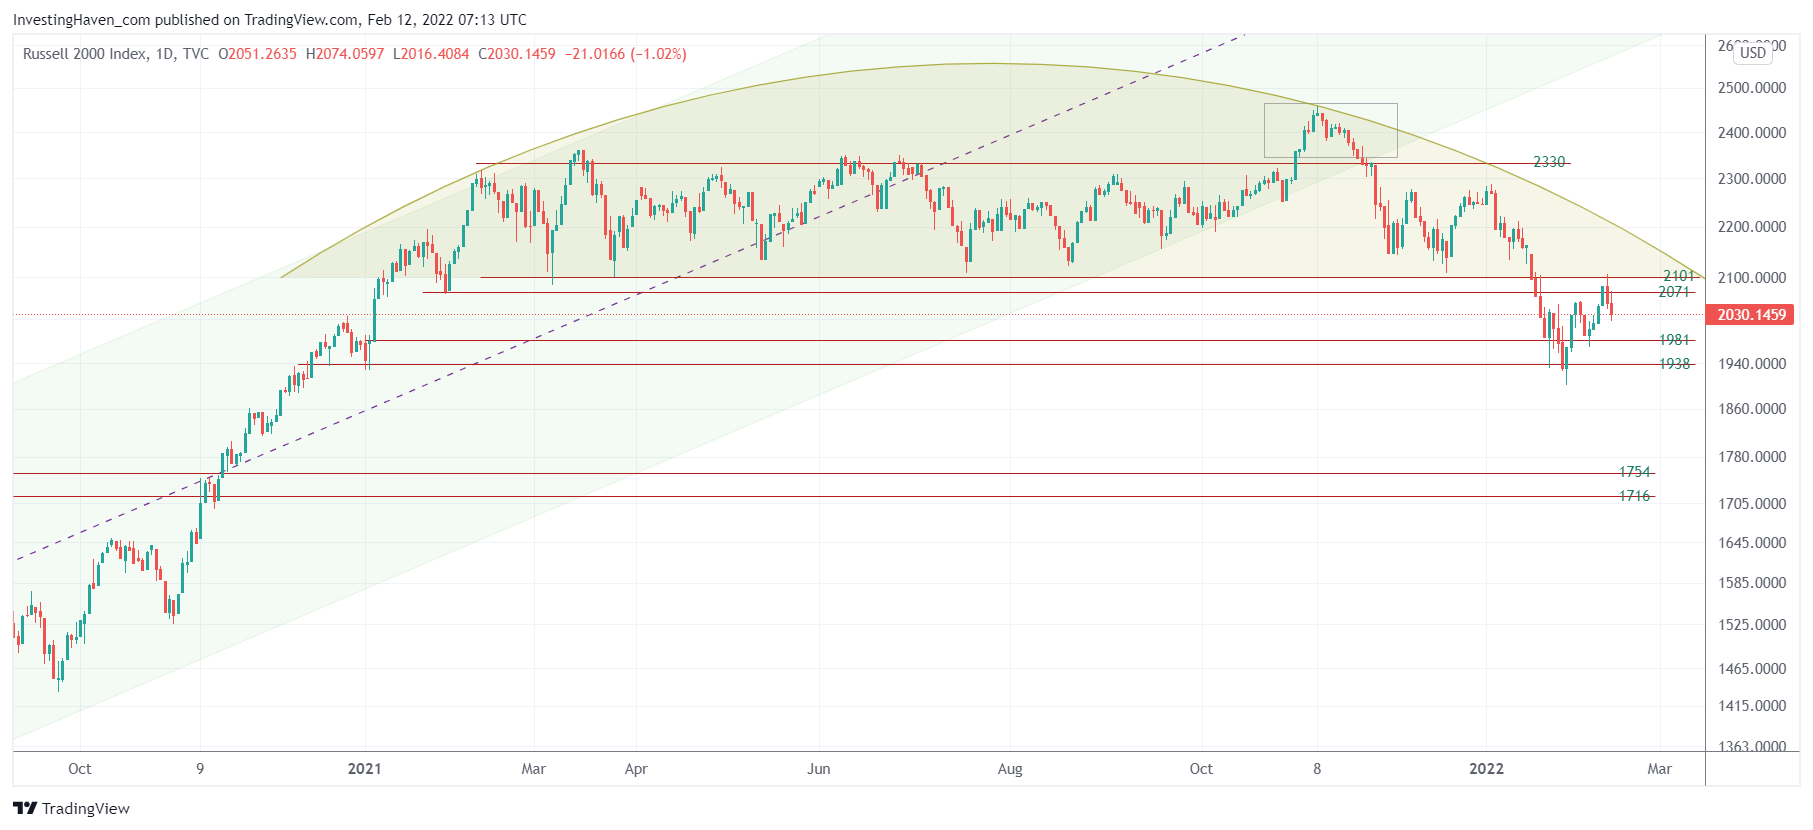
In the meantime, talking weakest segments in the market, here is another one: Russell 2000. You will vividly remember how we identified 2101 points in this index as the line in the sand, particularly in this article: When Will The Next Market Crash Start?
Well, on Thursday, this index printed a rejection right at… 2101. Coincidence, right?
Not really, the market is now aligned in its intention: lower before a move higher. Some segments will be hit hard in the next 2 to 3 weeks. We cannot rule out a flash crash, it might not happen but we believe one aggressive wave of selling is near.
A quick drop to 1716 in the Russell 2000? One that will be bought intraday, and a few days later we are back near 1900? Why not? This market is merciless, violent, this is certainly a feasible scenario is what we are thinking.
 What’s even more interesting: a few specific segments start looking really bullish. In fact, they have one thing in common: physical goods.
Copper miners start looking really bullish, silver start looking wildly bullish (not ready to trend yet, but it’s a matter of time), the graphite sector is as resilient as you can imagine.
In our Momentum Investing weekend update we shared the top symbols in each of the sectors mentioned above: top copper setups, top silver setups, top graphite setup, top agricultural stocks. We also mentioned a few more symbols that have a bullish long term profile, say 3 to 6 months out. In our Trade Alerts auto-trading strategy we accumulated another profit in our SPY options auto-trading strategy. We take care of our auto-trading members: they do nothing and get profits in return in a market that has confused at least 90% of its participants and probably destroyed (for once and for all) at least 50% of portfolios.


