
Fear is hitting extreme levels (source). The bull/bear ratio not yet although it came down significantly in October. Is this sufficient evidence to flash a contrarian buy in November of 2023? Or is a market crash underway?
The short version of the answer: no.
The longer version of the answer: we need to see evidence of turning points in leading indexes, first and foremost the S&P 500, before getting excited about a contrarian buy signal.
In recent weeks, we published a few discussions with relevant insights.
A Bullish Stock Market Forecast For November 2023
Will The US Dollar Index Find Resistance At 107 Points?
How To Know When The S&P 500 Confirms A Bullish Turning Point?
While the CNN fear & greed, more of an anecdotal indicator, is suggesting extreme fear levels among market participants…
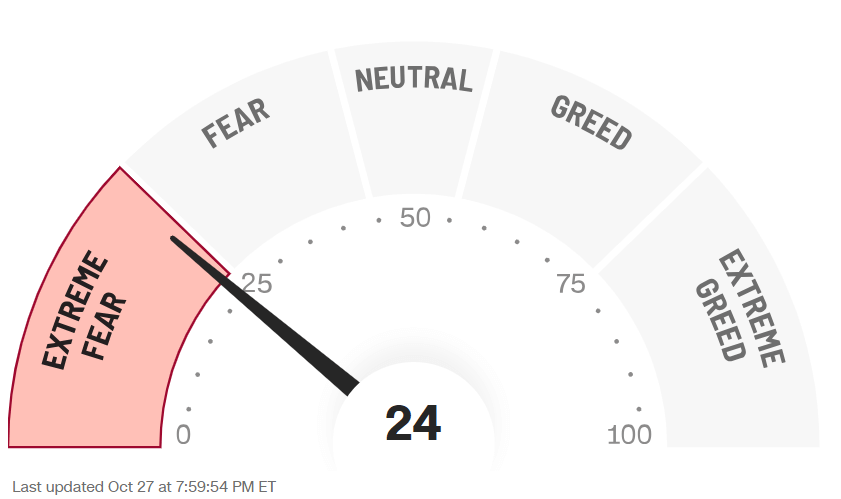
… the bull/bear ratio did not fall to extreme levels:
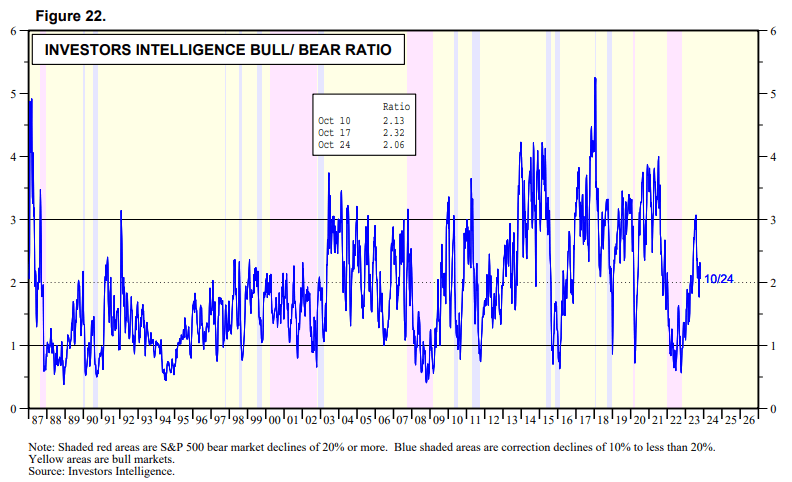
On the other hand, the bull/bear ratio only falls to extreme levels, below 1, a few times per decade. It spent almost the entire year of 2022 below 1, it won’t quickly reach those levels again.
Readings below 2 have been also unusual in the last 15 years. In a way, this current level is quite bearish.
That’s why we go back to our rule of thumb – when is the S&P 500 confirming a bullish turning point? Based on extensive research, having analyzed 40 years of S&P 500 price action, we do know the following (from the detailed analysis available in our restricted research area Downside Targets Are Being Hit – Selection Of Potential Momentum Stocks For Q4):
In case the S&P 500 develops a turning point, within the purple box indicated on our chart, we must see one of the following 2 developments unfold in the coming days and week:
- Three large wicks (intraday reversals) near 4300 points (SPX futures) printed within a period 5 days.
- Two large wicks (intraday reversals) near 4300 points (SPX futures) and one large green candle within a period of 5 days.
The above rule of thumb is what matters for the coming days and weeks, to understand if stocks are starting their year-end rally.
Follow our premium research work in the Momentum Investing service >>


