In the world of financial markets, there are various tools and indicators used to gain insights into market movements and trends. One such indicator is the euro, which serves as a leading indicator for global markets. By analyzing its long-term chart, we can derive valuable information about the direction of global markets and potential opportunities for investors. In this article, we will explore the significance of the euro as a leading indicator as it enters a crucial area, examine its current chart pattern, and discuss our expectations for the future.
Previously, we have written about other leading indicators we track in our methodology. We recommend checking out the following articles, also as readers can verify the validity of our forecasts based on our leading indicator readings:
This Leading Indicator Has A Summer Message For Stock Market Investors (end of June, 2023)
This Leading Indicator Loses Bullish Structure, Now Very Vulnerable (May, 2023)
This Leading Indicator Has A Summer Message For Stock Market Investors (April, 2023)
Silver’s Leading Indicators Suggest It Will Resolve Higher (mid-June, 2023)
No Stock Market Crash In 2023 (October, 2022)
Understanding the Euro as a Leading Indicator
A leading indicator provides valuable insights into the future direction of a market. In the case of the euro, we do not trade it directly, but instead utilize its trend and chart patterns to gain a deeper understanding of how it might influence global markets. The euro has a strong correlation with risk assets in global markets, making it an important gauge for investors seeking to navigate the financial landscape.
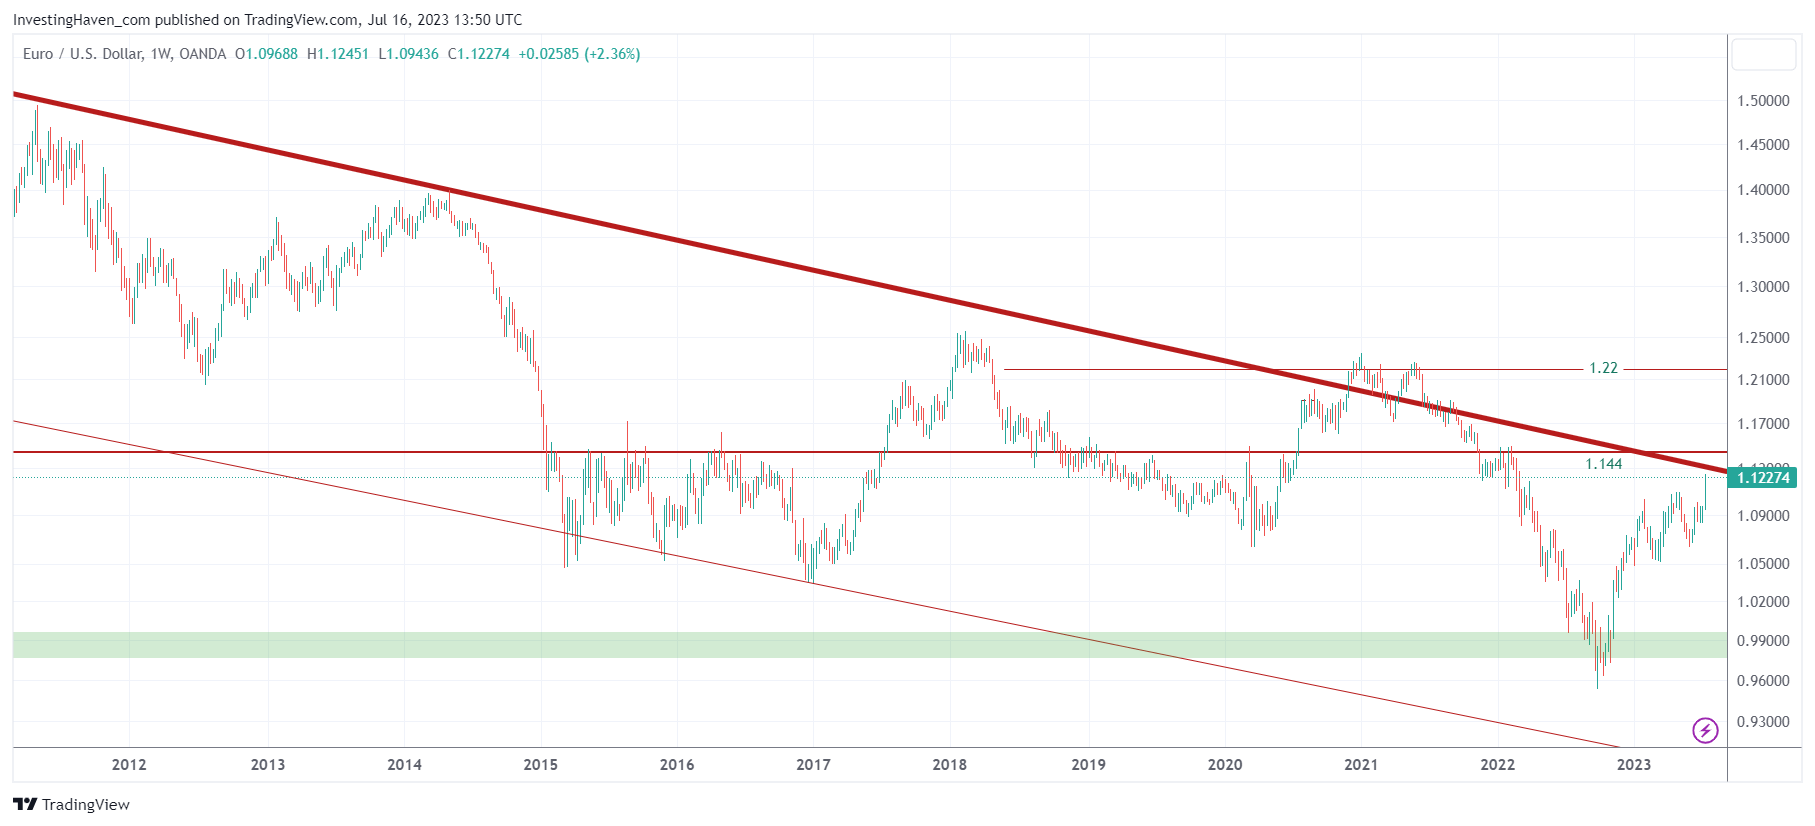
Examining the Euro’s Long-Term Chart
The 12-year chart of the euro is currently approaching a crucial area where it is close to touching a multi-decade falling trendline. This trendline has significant historical significance, as it represents a major resistance level that has constrained the euro’s upward movement in the past. Observing the chart, we can see that back in 2020 and 2021, the euro spent a remarkable 7 full weeks above the falling trendline, marking a highly bullish period. However, as the Federal Reserve became more aggressive in its monetary policy by tightening through interest rate hikes, the US dollar embarked on an epic bull run, causing the euro to lose its momentum and break below the trendline.
Expectations for the Future
Based on our analysis, we anticipate that the euro will spend the next 4 to 8 weeks testing the multi-decade falling trendline. This period of testing will serve as a confirmation of our bullish forecast for the summer of 2023. However, come September, we expect a temporary drop in the euro’s value. Following this pullback, we anticipate an end-of-year rally that will push the euro right above the falling trendline, signaling a positive outlook for the currency.
As we assess the current state of global markets, paying attention to leading indicators such as the euro can provide valuable insights into future trends. The euro’s long-term chart is now entering a crucial area as it approaches a multi-decade falling trendline. Our analysis suggests that the euro will undergo a period of testing, potentially lasting 4 to 8 weeks, before experiencing a temporary drop in September. However, we remain optimistic about the currency’s prospects, anticipating an end-of-year rally that will propel the euro above the falling trendline.
It is important for investors to consider the implications of the euro’s movements on their investment strategies. By monitoring the euro as a leading indicator, market participants can gain a better understanding of potential opportunities and adjust their positions accordingly. As we navigate the financial landscape, staying informed and utilizing valuable indicators like the euro can provide a significant advantage in making well-informed investment decisions.
Conclusions
In summary, the euro’s chart pattern and its role as a leading indicator offer valuable insights for global market participants. While the euro faces a crucial test in the coming weeks, our analysis suggests a bullish summer, a temporary pullback, and a potential rally towards the end of the year. By leveraging advanced charting insights, investors can position themselves to capitalize on potential opportunities arising from the movements of this influential currency.
In our Momentum Investing methodology, we send weekly market analysis with leading indicators which we use to identify broad market trends, turning point and volatility windows. We also use these leading indicators to sniff for sector strength.


