One of the leading indicators in our methodology is the the Russell 2000 index. It started breaking down, on Friday, October 27th, 2023. How concerning is this?
Update: this post was updated on November 2nd, 2023. The update is available at the bottom of this article, the other content of this post was not adjusted. We also add a comment about forecasting what’s next for the Russell 2000.
As said, we will re-iterate this, we do not expect a market crash even though fear is rising significantly (it is hitting extreme levels).
Essentially, the Russell 2000 fell below its 2022 lows. It is the only index to fall as low as the June & Oct 2022 lows.
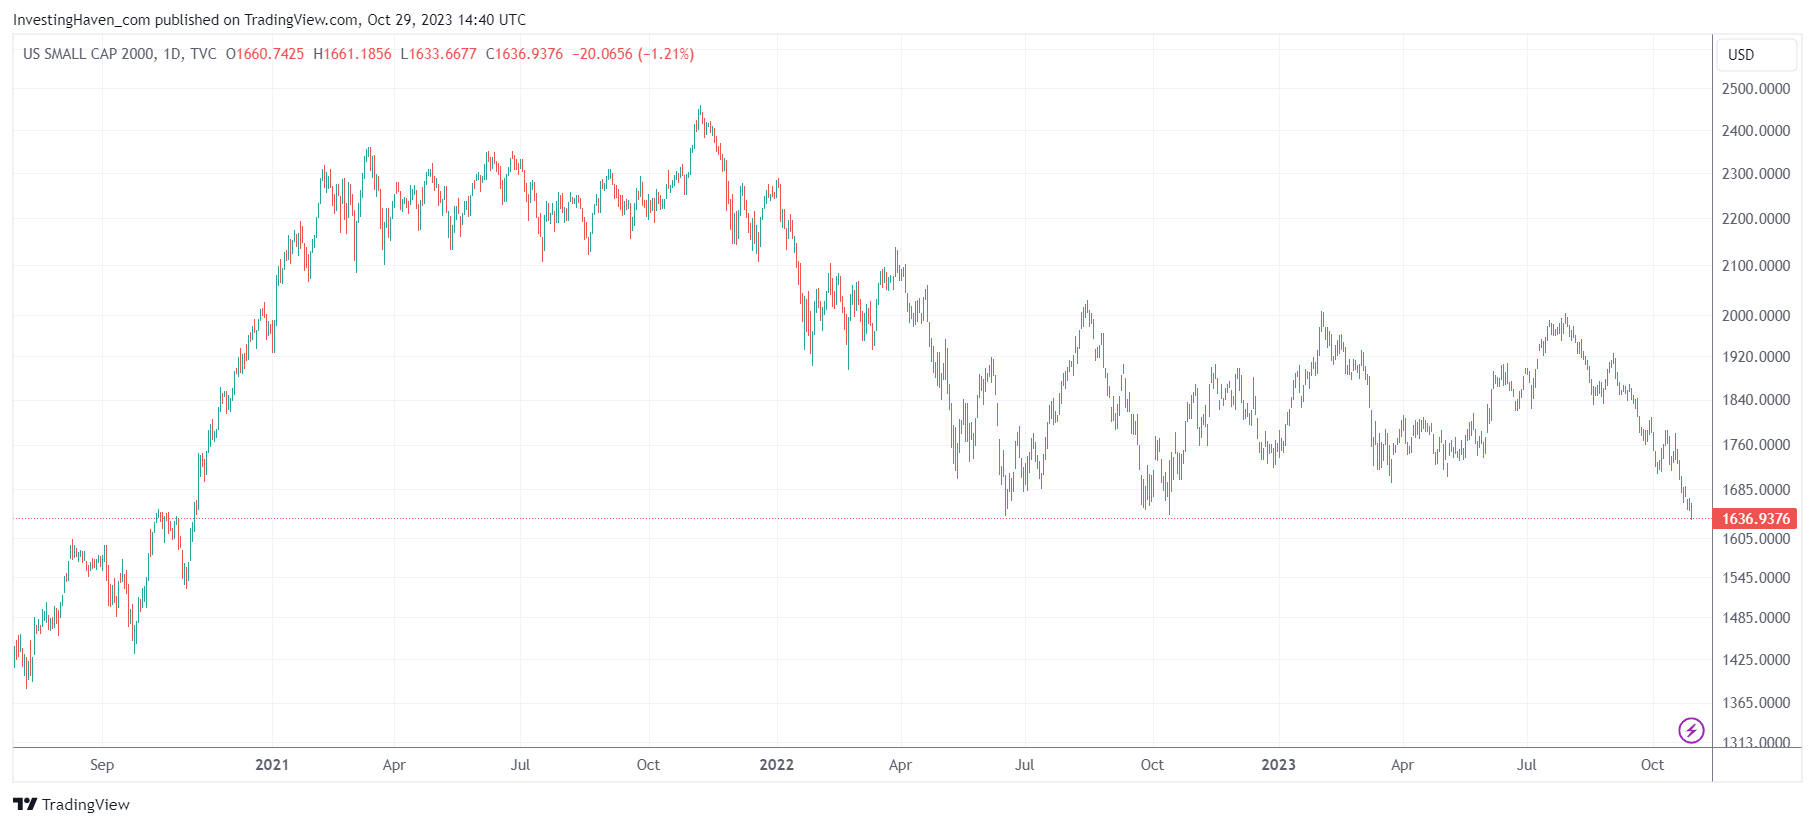 Technically, there is no breakdown, not yet at least, because a recovery is still possible in the coming days.
Moreover, a reasonable target for the Russell 2000 might be 1550 points, maybe even 1535 points, which might come with support building in the other indexes.
From our perspective, when we look at the volatility indexes, we see a divergence (we share more detail and all charts in our premium service): the S&P 500 looks worse than its volatility indexes. Most often, volatility indexes have it right.
What we don’t want to see is a continued rise in Yields, that would be really bad news. It’s the single most important risk in markets at the time of writing.
That said, we will reiterate what we said in another blog post – all that matters right now is a turning point formation particularly in the S&P 500.
In case the S&P 500 develops a turning point, within the purple box indicated on our chart, we must see one of the following 2 developments unfold in the coming days and week:
- Three large wicks (intraday reversals) near 4300 points (SPX futures) printed within a period 5 days.
- Two large wicks (intraday reversals) near 4300 points (SPX futures) and one large green candle within a period of 5 days.
The above rule of thumb is what matters for the coming days and weeks, to understand if stocks are starting their year-end rally.
Update: the remainder of this post was updated on November 2nd, 2023.
The four trading days following the breakdown of Russell 2000 came with constructive price action, especially November 1st and 2nd. As seen on the next chart, comparing it with the one above, the Russell 2000 recovered from its breakdown.
It is clear, at the time of writing (Nov 2nd, 2023) that the Russell 2000 was able to avoid a breakdown. It thoroughly tested its breakdown level, but did not violate it.

The same chart, with annotations, is shown below. The chart patterns also highlights the complexity and dynamics that are working on this small cap index.
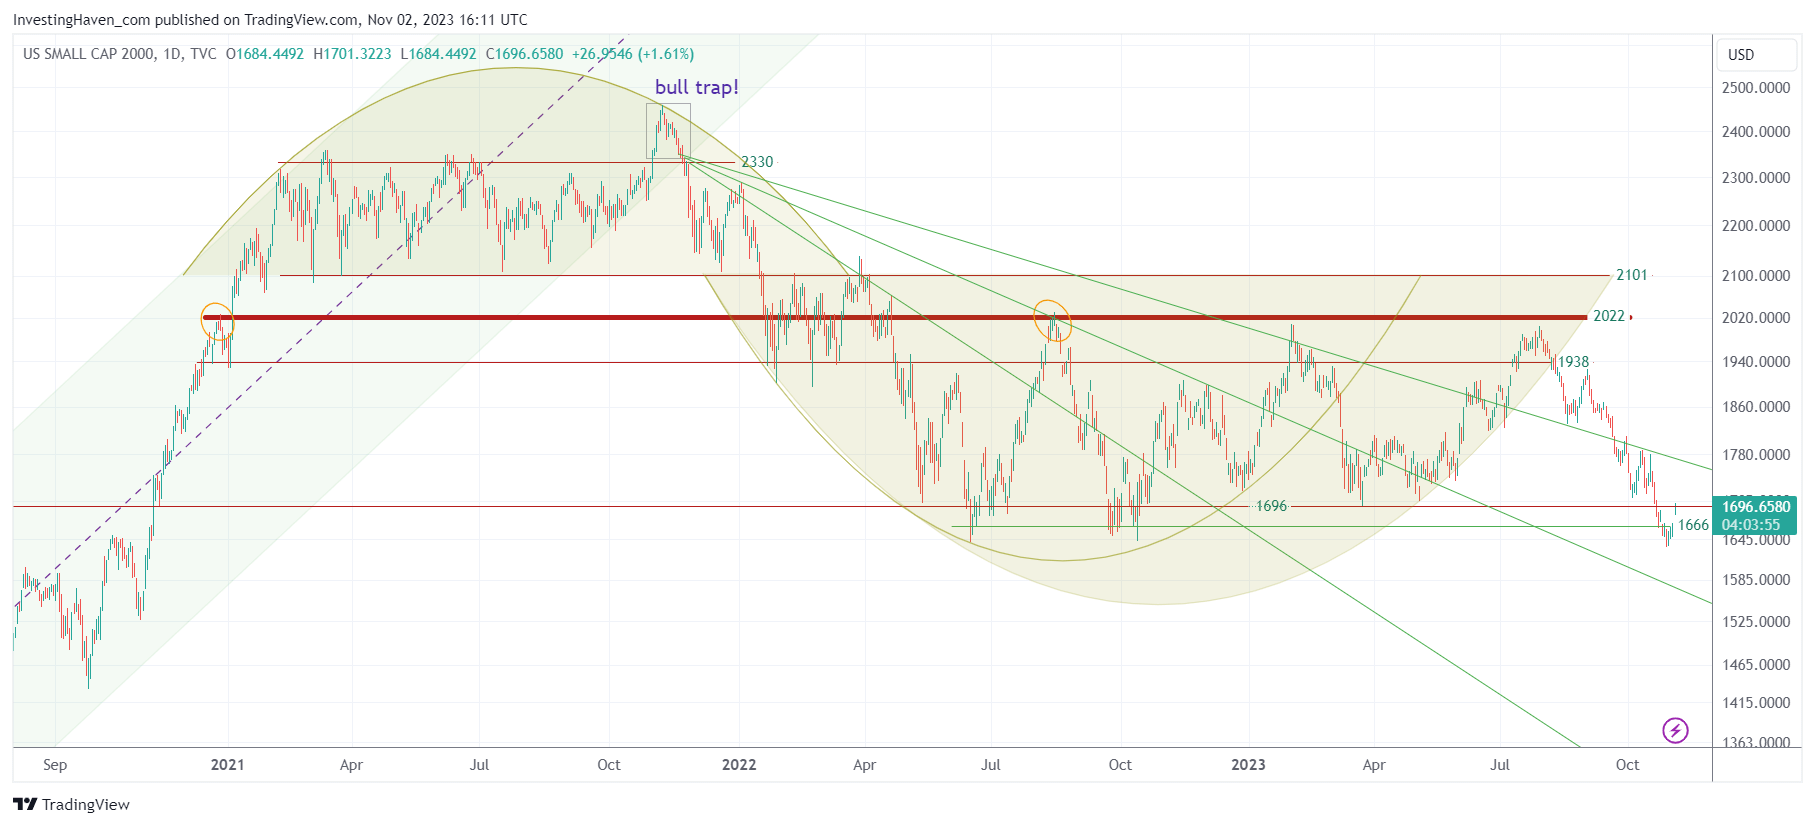
All we can conclude, carefully looking at this last chart, is that 1666 remains, by far, the most important support level. Moreover, the falling trendlines should be cleared, with 1750 points being the ‘line in the sand’ level, to turn this chart into a more constructive setup. While these conclusions may sound simple, which they are, it is pointless to make the conclusions more complex, even though the chart has quite some chart complexities (for forecasting).
Do you prefer to let us do the hard work while you focus on other challenges in your life. Please consider our unique passive income service – create compound portfolio growth by outsourcing your trades.


