
The S&P 500, one of the most widely followed stock market indices, has been on a remarkable journey over the past 40 years. One fascinating aspect of its recent performance is its proximity to the 40-year rising trendline. In this article, we will explore the significance of this long-term trendline, how it has shaped the current reversal structure, and what it means for the future of the S&P 500. In doing so, we look at the big picture of financial markets. That’s because many investors get too easily distracted in day-to-day price movements, short term forecasts, the endless stream of noise created by financial media, and the countless number of opinions on social media.
While it might seem that our focus is too long term oriented, we look at multi-decade trendlines, we want to point out that there are even longer timeframes to look at. The longest relevant timeframe we analyzed is the Dow Jones Historical Chart On 100 Years.
This type of big picture analysis can help investors stay focused on the long term trend while still looking for opportunities on the lower timeframe. At InvestingHaven, we use these insights in doing our analysis as per our Rule of Three methodology.
The 40-Year Rising Trendline on the S&P 500 chart
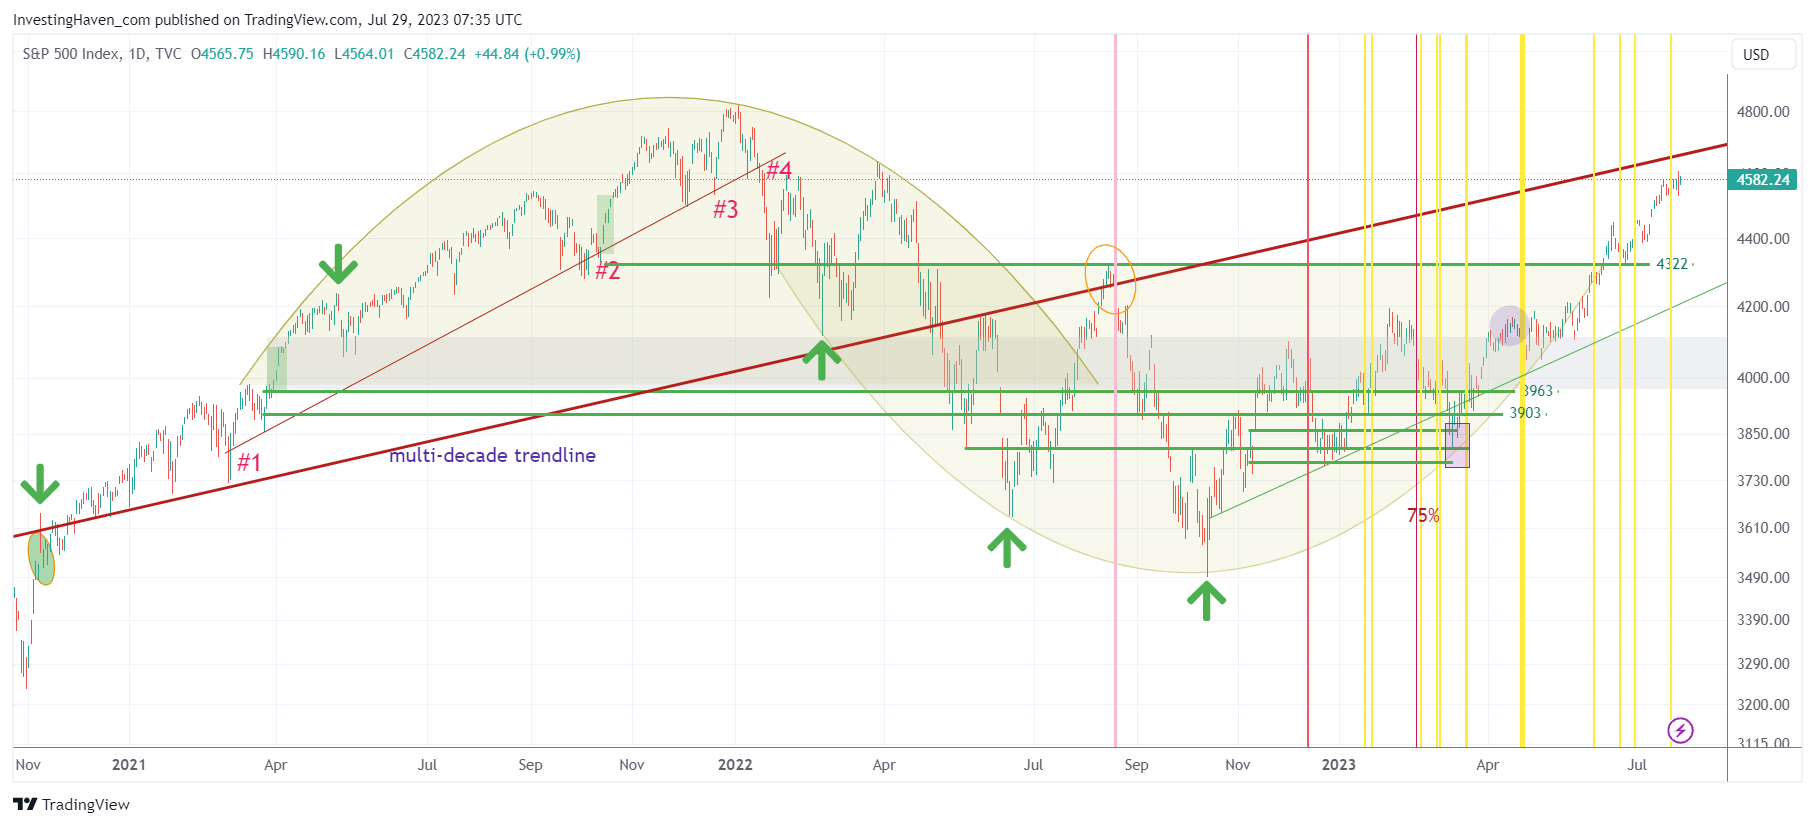
The 40-year rising trendline on the S&P 500 chart originates from 1982, a year marked by the end of a severe bear market and the beginning of a prolonged bull run. This trendline has been a guiding force for the index’s long-term movements. In November 2020, the S&P 500 achieved a significant milestone by breaking above this trendline. It marked a crucial turning point, signaling a potential shift in market sentiment from bearish to bullish.
Since then, the rising trendline has acted as both support and resistance. In April 2022 and August 2022, the S&P 500 encountered the rising trendline as a resistance level, causing temporary pullbacks in the market. The fact that the trendline is still influencing the index’s movements after more than two years since the breakout underscores its continued relevance and importance.
The S&P 500 Bullish Reversal
The S&P 500 chart shows a distinctive bullish reversal pattern, indicating a shift from a bearish trend to a bullish one. This pattern is evident from the series of higher highs and higher lows that have formed since the breakout above the 40-year rising trendline. Higher highs reflect periods when the index reaches new peaks, while higher lows signal a strong support level during market pullbacks.
This bullish reversal pattern confirms the strength of the current uptrend and suggests that investors are optimistic about the market’s prospects. Traders and investors often look for such patterns to identify potential entry points in an uptrending market.
Positive Momentum
Positive momentum is another encouraging sign for the S&P 500. The upward slope of the chart demonstrates that buyers are consistently driving the index higher. The recent rally indicates a bullish sentiment prevailing in the market. Positive momentum can attract more investors, leading to further upward movement in the index.
However, it is essential to monitor momentum indicators closely, as markets can be dynamic and subject to changes in sentiment. A weakening of positive momentum or any signs of a potential trend reversal should be carefully evaluated by investors and traders.
Future Resistance Levels
As the S&P 500 continues its ascent, traders should be mindful of potential future resistance levels that could hinder further upside movement. While the index has recently broken to 52-week highs, there will be areas of price congestion ahead. One such level to watch is the region that coincides with the 40-year rising trendline.
Volatility Windows
Additionally, the volatility windows, marked by the yellow vertical lines on the chart, suggest periods of potential increased market turbulence. The upcoming volatility window, expected in mid-August to mid-September, may offer significant trading opportunities and provide valuable insights into the market’s direction.
Conclusion
The S&P 500’s current positioning relative to its 40-year rising trendline is a critical development that investors should closely monitor. The bullish reversal pattern, positive momentum, and potential future resistance levels indicate an overall optimistic outlook for the index. However, market dynamics can shift quickly, and prudent risk management remains essential.
As the S&P 500 approaches its 40-year rising trendline, investors and traders should exercise caution and carefully evaluate market signals. The interaction with the trendline in the coming weeks may provide further insights into the index’s future trajectory. With the volatility window on the horizon, traders should be prepared for potential increased market turbulence as we head into September. On the other hand, keeping the big picture in mind will help investors stay the course, in doing so the 40-year rising trendline can help investors tremendously. As always, thorough analysis and staying attuned to market developments will be key to navigating the evolving landscape of the S&P 500.
For investors that have a long term timeframe, we created the following in-depth sector reports: AI & Robotics top stocks, Lithium & Graphite top stocks, Pure Play Silver Stocks Selection.


