
Silver is working on a double breakout – a medium term and a secular breakout. In fact, silver already confirmed its medium term breakout; it is now working on confirming its secular breakout. Is the silver market breaking out? Yes, it is, with a bullish target of $34.70 which is a forecast we published a long ago.
Related – When Exactly Will The Price Of Silver Start A Rally To $50?
After a really long consolidation which lasted more than 3 years the time has come for silver.
Silver double breakout is already partially confirmed. The secular silver setups look truly awesome.
In this article, we do not analyze silver market fundamentals because we discussed them extensively in the past in our silver prediction as well as our detailed silver squeeze analysis. Instead, we focus on silver charts in this article.
Silver completing a bullish basing pattern
In general, one of the most powerful chart structures is the bullish basing pattern.
In essence, a bullish basing pattern is a long consolidation in which key support levels are respected. The consolidation is orderly, it occurs after a big rise. Remember, the longer the consolidation, the higher the upside potential.
Silver’s basing pattern has all these characteristics:
- A big rise in the period June/July of 2020.
- A long consolidation since August of 2020.
- Key support levels around 20 USD/oz were respected.
- The only ‘violation’ of key support occurred late summer 2022. As seen on the chart, this ‘violation’ morphed into a series of 3 bullish micro-patterns, right below 20 USD/oz.
In sum, the daily silver price chart has a very bullish looking. It confirmed the start of an epic breakout.
It is crystal clear from the following silver price chart. Question: is the silver market breaking out? Answer: yes, the silver market is working on a double breakout, one of which already confirmed.
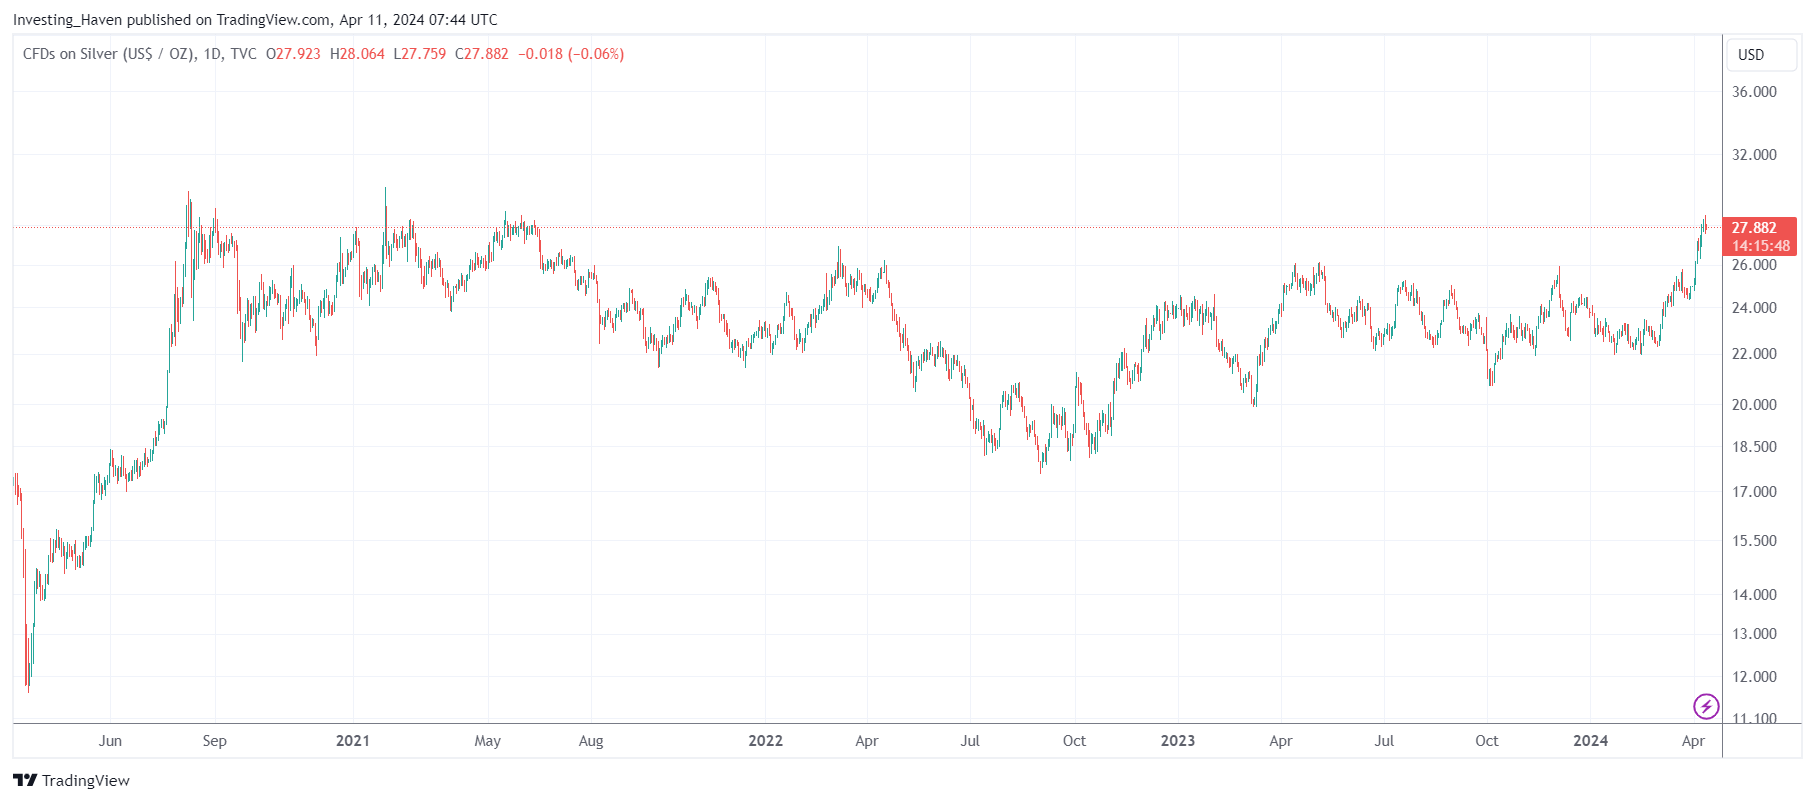
Source – silver price chart
Silver breakout on the medium term timeframe
The above chart, without annotations, helps us understand that silver’s price chart has a bullish setup. The setup is strong enough to push the price of silver much, much higher, short term / medium term / long term.
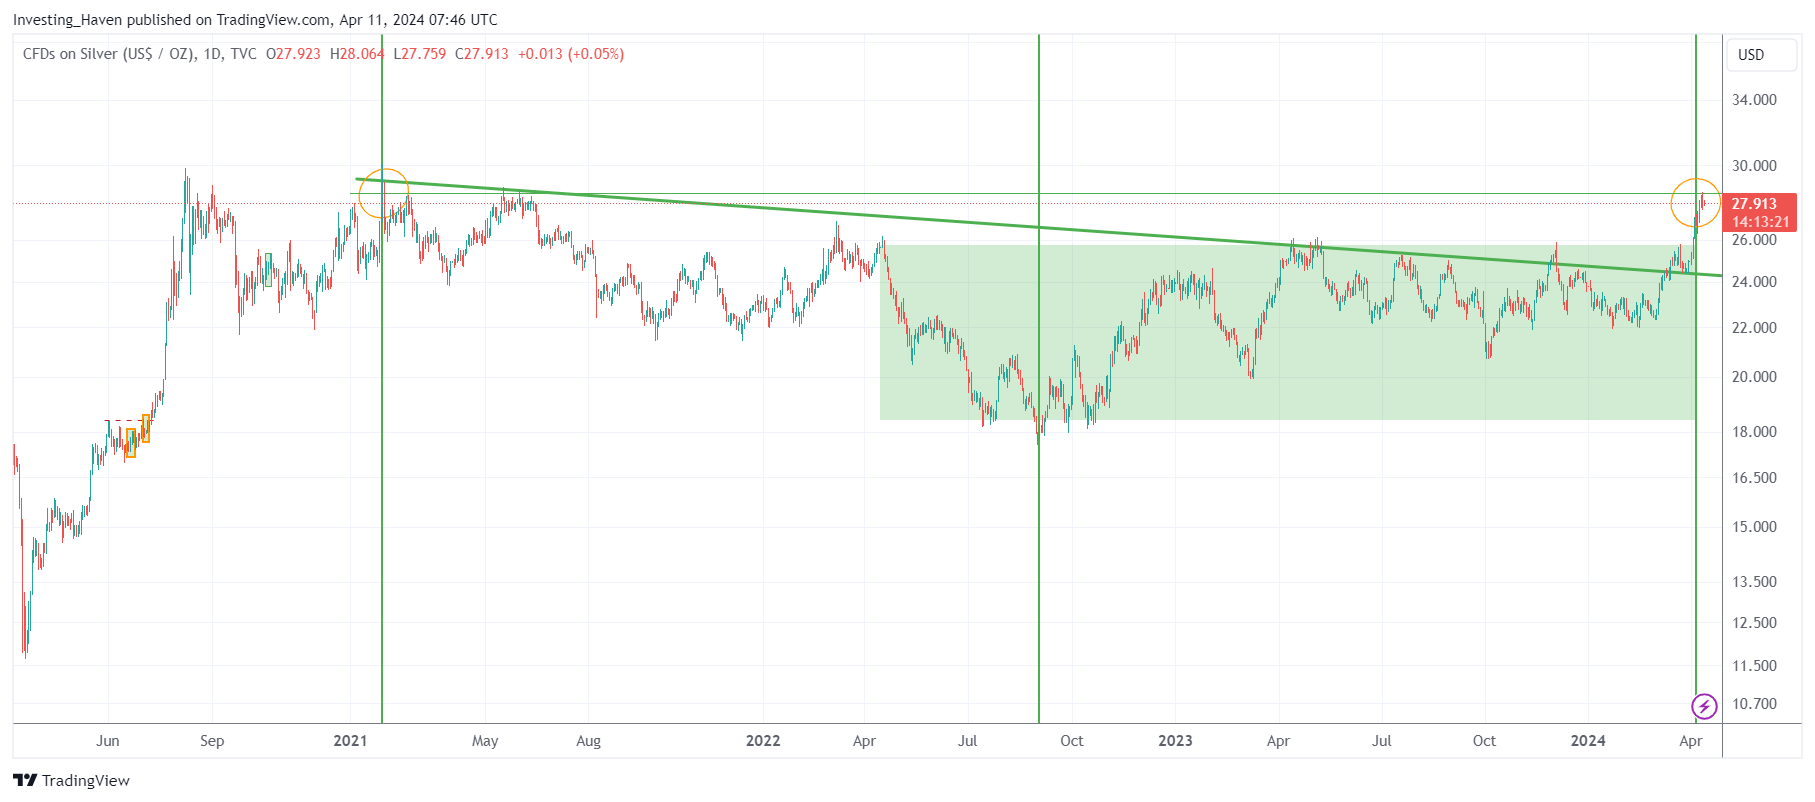
Below is the same silver daily price chart, but with our annotations:
- The falling silver trendline since the 2021 top – as seen, silver is now for several consecutive days above the falling trendline – in a way, this is a breakout.
- The bullish reversal structure since April of 2022 – as seen, the reversal structure, the green shaded area, is now complete.
If we combine both ‘chart events’, we can conclude that silver has broken out of its multi-year downtrend. In other words, this is a silver price breakout on its medium term oriented timeframe. This silver breakout is confirmed as there are 8 daily candles above the breakout level.
It is fair to say that silver’s breakout is already confirmed as it did rise for 8 consecutive days above 26.20 USD/oz. The silver market breakout on the medium term oriented timeframe is confirmed.
The silver market breaking out on its secular timeframe
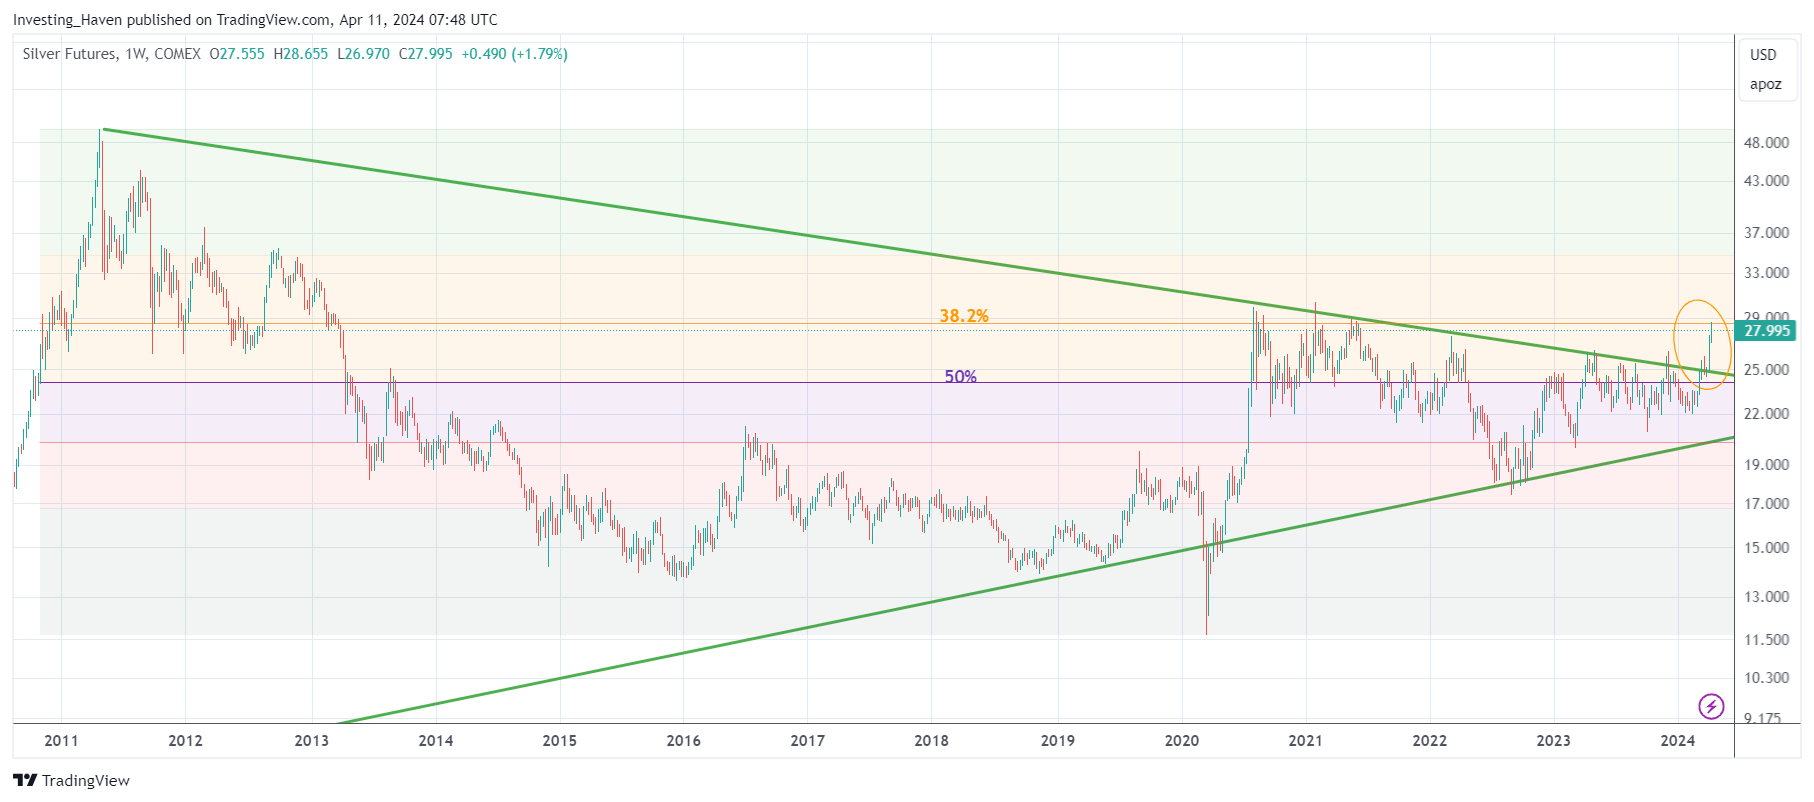
Now, let’s turn to silver’s secular timeframe. We use the weekly silver price chart to analyze secular trends including a possible secular silver breakout.
The annotations on this chart are important. The Fibonacci retracement level that truly matters is the 50% retracement level which comes in around 24.50 USD/oz.
As seen, silver moved above the falling trendline which connects the 2011 peak with the highs since 2020. Moreover, silver is now above its 50% retracement level. What is truly unique is that silver is now above both patterns on its secular chart – this has not happened before.
What does this mean? On the secular timeframe, silver’s breakout is happening now. However, as this is a weekly chart, we need several weekly candles above 26 USD/oz to confirm the secular breakout. A secular breakout simply takes more time to be confirmed.
Moreover, and this might be the proverbial elephant in the room, the triangle visible on silver’s secular breakout is nothing short of beautiful, hence powerful. Remember, the longer a chart pattern, the stronger. This means that the power unleashed by the ongoing silver market breakout is tremendous.
Conclusion – Silver breakout happening now
If we combine the silver breakout insights, from the daily and weekly timeframes, we conclude the following as it relates to the question “is the silver market breaking out“:
- The breakout point on both timeframes is the same – 26 USD/oz.
- Silver’s breakout on the daily timeframe is now confirmed: there are 8 consecutive daily candles above 26.20 USD/oz. This is the ultimate confirmation of a silver breakout on its medium term oriented timeframe.
- Silver’s secular breakout on its weekly chart is happening now – silver needs a few weekly candles above 26 USD/oz to confirm the secular breakout.
The important takeaway on the question “is the silver market breaking out” is that silver trades above its double breakout price point which is 26 USD/oz.
As said, silver’s breakout is happening on two distinct timeframes, one of which confirmed. It is the first time that the breakout level on both timeframes are identical. It is also the first time that the falling trendlines, from silver’s 2011 peak and its 2020 peak, on both timeframes, are cleared (to the upside).
Silver’s chart setup has everything to qualify as a breakout.
Silver needs some follow through now – April 2024 is becoming a big month for silver.
Anecdotal evidence of more upside potential in silver
Fun fact – you would have expected Wall Street Silver to be in overdrive with the ongoing silver breakout but nothing is further from the truth. If this would mean that the silver breakout is not being recognized and respected, it would be the ultimate confirmation that silver has much more upside potential, from an anecdotal perspective. That’s because Wall Street Silver’s success coincided with a major top in the silver market in 2021.
If you like our silver analysis, we invite you to follow our premium gold & silver alerts >>


