
Gold and silver experienced a decline about a week ago, the day when 10-Year Yields pushed to their highest point in 15 years. It is so easy to get caught up into fear simply because of fear created in media, or by looking at daily price changes. But, as said countless times, the one and only thing that matters are leading indicators. We explained this in great detail in our gold forecast, also our silver forecast, where we explained which leading indicators truly matter for both precious metals. Here is the most important leading indicator of gold, screaming WILDLY BULLISH.
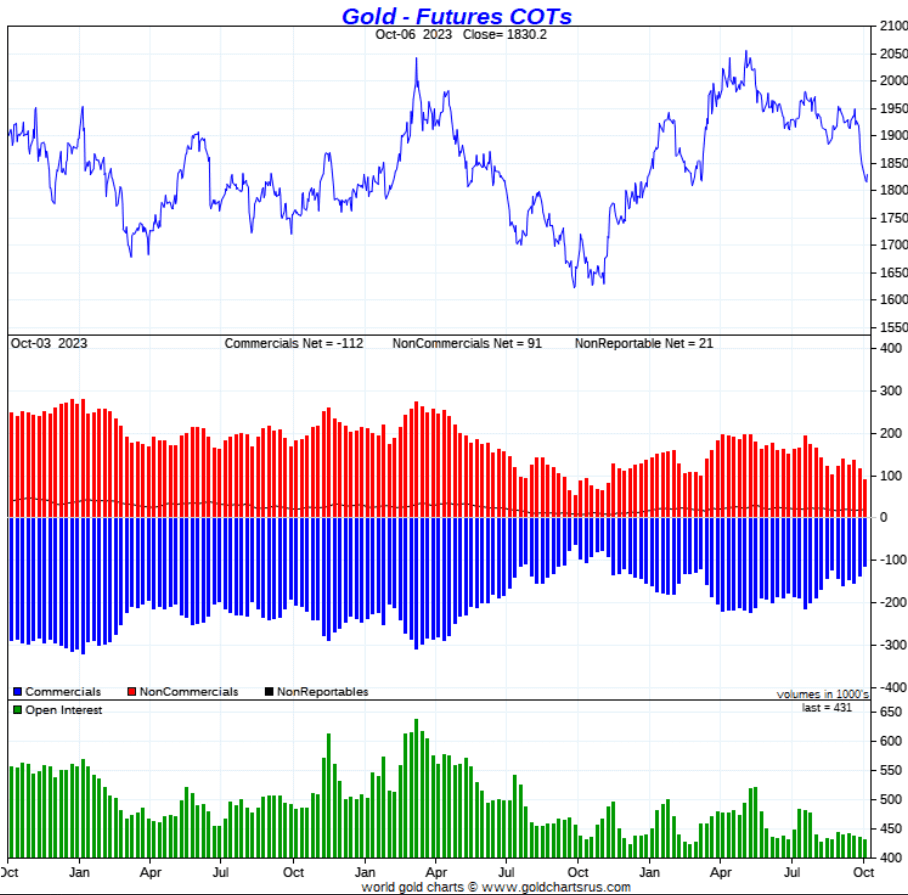
The leading indicator we are talking about is CoT (source). It is a stretch indicator. In other words, its setup suggests how much price move higher or lower, depending the setup and dominant trend. In other words, it is an indicator that suggests the likelihood of a turning point to occur. It is not a timing indicator, it will not tell exactly when a turning point might occur.
That said, we focus on the net short positions of commercial participants in the gold futures market, the blue bars in the center of the chart. When their positions get below 100k contracts (net short), it implies the price of gold is stretched to the downside, there is not a lot of downside left. This is indicative of a turning point, a rally should occur soon, that’s how to read these setups.
As seen, in the last 3 years there was only one occurrence in which net short positions of commercials fell below 100k contracts: summer of 2022. That setup, last summer, resulted in a price rally of close to 30%.
In 2023, we had one situation in which net short positions of commercials got close to 100k which was in March. The subsequent really was close to 15%.
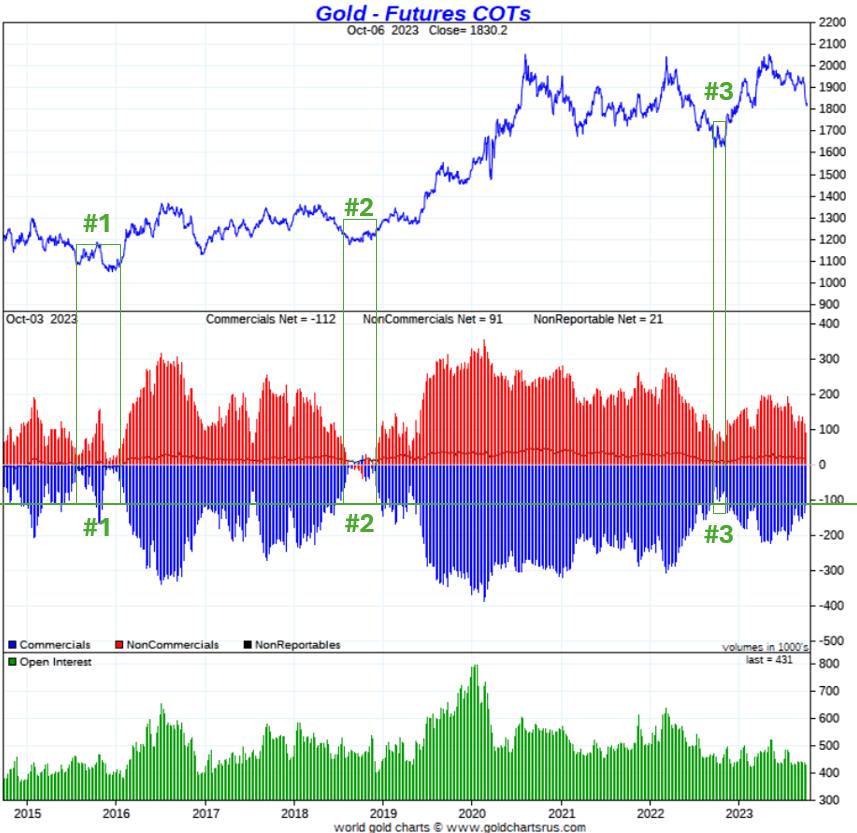
In order to put this in perspective, we zoom out 10 years. Below is the same report since 2014.
In the last 10 years, the gold futures market had only 3 occurrences in which net short positions of commercials fell below 100k contracts, as indicated with the numbers 1, 2, 3 on the chart. The subsequent rallies:
- Situation one resulted in a rally of 30%.
- Situation two eventually resulted in a rally of 80%.
- Situation three was the summer of 2022 which resulted in a rally close to 30%.
The annotations in green are ours, the charts are from goldchartsrus.com.
Conclusion?
There is not a lot of downside in the price of gold. On an historical basis, the current readings are close to being extreme. In each and every similar situation in the last 10 years a strong rally of at least 25% occurred.
This bodes well for silver.
In our premium services we feature much more detail, particularly on silver. We believe this is an epic turning point, in silver particularly, we explained this in great detail in Turning Points 101 – Major Harmonic Setups In Markets & Metals (restricted research area).


