
While 99.99% of analysts remain focused on price analysis, our analysis differentiates by making use of both axes that charts offer (x and y). The point is this: there is a wealth of information that comes from the time axis, why let the timely information from the time axis go to waste? As per our price and time readings, we forecast that November of 2023 will be a bullish month. This could set the stage for a test of ATH early 2024.
While price analysis is very important, often leading for decisions, our thesis is that time analysis is even more important to understand periods in which ‘good things tend to happen’ vs. ‘not-so-good things are more likely to happen.’ The latter we tend to call ‘volatility windows’, and while nobody is able to be 100% accurate 100% of times, we believe our volatility windows forecasts in 2023 have been unusually accurate.
A volatility window should not be confused with a crash, it’s more of a time window in which a pullback might occur of high/mid/low intensity. In a way, with our forecasts, we predict when this popular fear indicator will move to lower readings, way before it happens.
Very often, when engaging with financial market analysis and investing, success comes with acting and thinking in the exact opposite way of what is common belief and intuitive thinking. We explained this with lots of illustrations in Tsaklanos his 1/99 Investing Principles.
Embedded in this article is the S&P 500 chart.
Price analysis would lead investors to follow the rising channel, one that is blatantly clear on the chart.
By using time analysis, we forecasted that the S&P 500 would drop to 4250-4300 points in the 2nd half of September. The purple box on the chart is the one we forecasted back in August. We could only do so by applying timeline analysis.
In that respect, we refer to the yellow lines on the S&P 500 chart: those are the volatility windows we forecasted, or (like in the last occurrence in August) the yellow line visualizes the start of a volatility window.
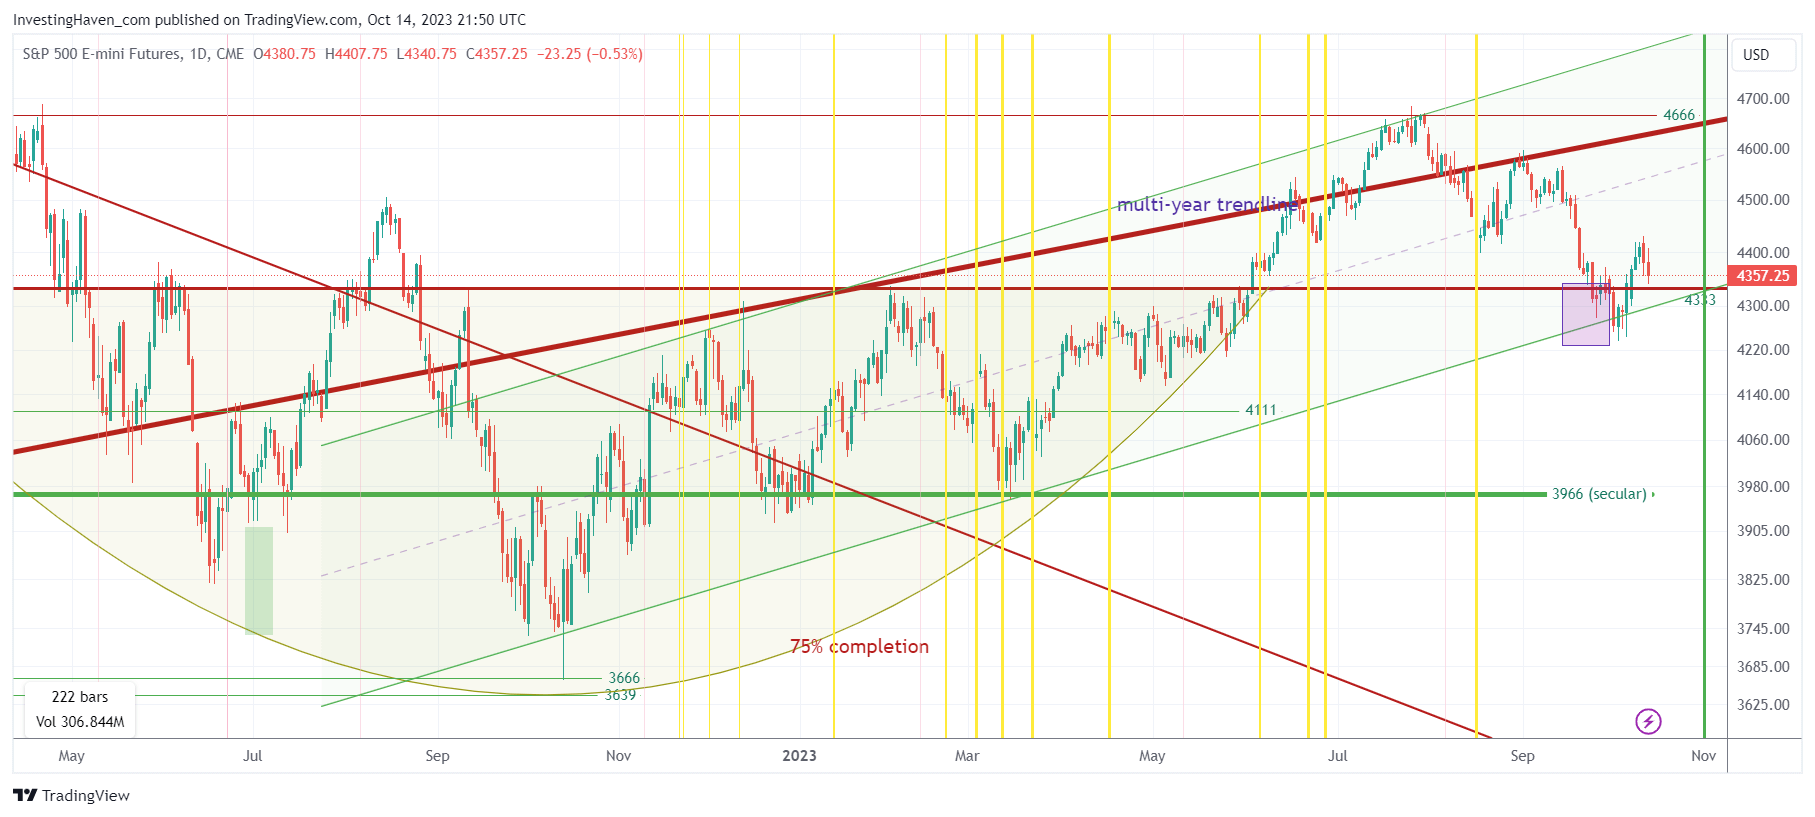
The good news for investors is that a green vertical line is visible on our chart, due early November. This means that a bullish time window is upon is.
With these bullish time windows vs. volatility windows in mind, it is easy to use price analysis as a confirmation (or invalidation) of our forecasts: the S&P 500 has to respect the rising channel, if it does and the index does not violate 4330 points by the first week of November, it will imply that the probability of a bullish month of November will have risen exponentially. In that scenario we expect readings around 4666 in the S&P 500 around year-end. When combined with the 2 charts released in the article How To Know If Stocks Will Tank In 2024? we could see, best case, a test of ATH in Q1/2024.
Do you like this analysis? You can receive much more detail and charts, we recommend to become a premium research member >>


