The volatility window is here. Since a long time, our forecast has been, in our premium services, that volatility will pick up in the last 10 trading days of June 2023. Visibly, the market confirmed this week that a local top was set right at the start of our forecasted volatility window (June 16th, 2023). Even in the public space we mentioned Enjoy The Party But Watch Out June Won’t Come With A ‘Happy End’, published about a month ago. Are you ready for a pullback? To be clear, we are predicting a short-lived though intense retracement, not a stock market crash.
We have a few charts that make our point.
First of all, financial media headlines, they are too bullish.
As said in The Financial Media is Not Your Friend – How to Avoid Getting Trapped, better be careful with those headlines. Most of the time, they are contrarian.
Whenever media outlets are publishing these type of headlines How the Value Trade Has Been Smoked by the AI Frenzy you know that a pullback is just around the corner.
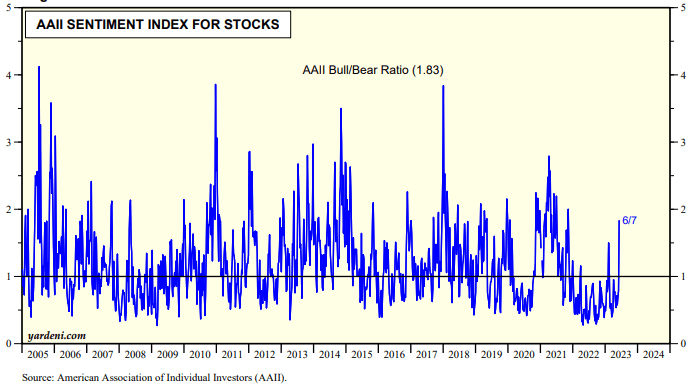
Second, sentiment hit the most bullish levels since October of 2021, the top of the stock market. That’s a warning sign, for sure, although not a perfect timing indicator.
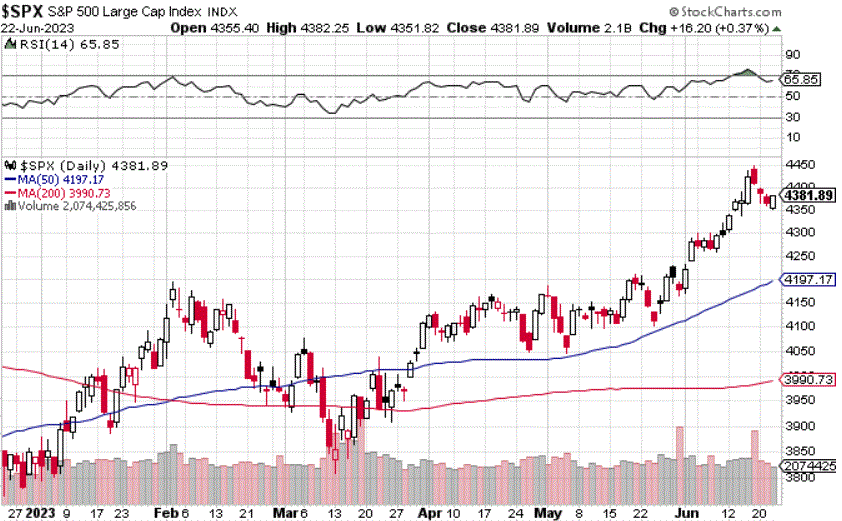
Third, although not the most attractive chart type, we see some value in the classic Stockcharts chart of the S&P 500. Visibly, this index is in overbought territory. A pullback is the most obvious outcome of this setup.
We can reasonably expect the 50 dma to be hit very soon, as early as next week. That’s a drop from 4381 to 4197 points. The question top of our mind is whether the 200 dma will be hit, at 3990 points. Our best guess is that the 200 dma will hold, SPX might drop to a level in between the 50 and 200 dma.
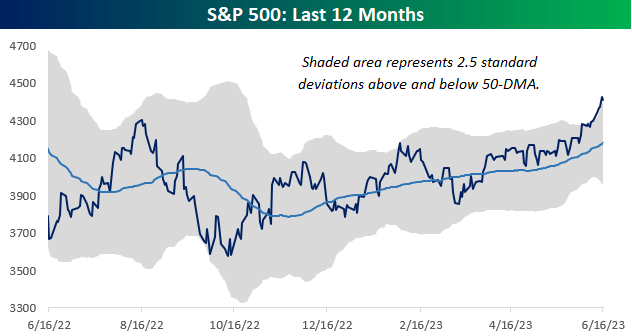
Also, our friends at Bespoke Invest confirmed the overbought conditions:
The S&P 500’s rally over the last several weeks has been a textbook example of a breakout. After gradually advancing within a trading range off its October lows, since early June, the S&P 500 has broken out above the August 2022 highs and into a new trading range. In the process of this move, the index has closed at overbought levels (one or more standard deviations above its 50-DMA) for fifteen straight trading days, and the last eleven of those have been closes of two or more standard deviations above its 50-DMA. Not only that, but over the prior five trading days, the S&P 500 managed to close more than 2.5 standard deviations above its 50-DMA. The data is clear. In the short term, the market is overbought.
The chart they shared this week visualizes their point and is additional confirmation that this is not a moment to be eager to enter the market, it’s a moment to be eager to wait for ‘buy the dip’ opportunities.
We have taken a bet on precious metals in our Momentum Investing service. It’s clear that broad markets are overbought and selling will start any time soon. While selling should be short-lived, it might get really intense. Who will be the beneficiary of stock market selling, acknowledging that the USD is pretty weak? Our thinking: precious metals. We created a selection of silver stocks that might benefit from a broad market pullback, accessible to premium members: Silver: Top Stocks For Long Term Portfolios >>


