
Bitcoin lost 53% after its $126K peak, erasing about $2T in value and triggering $1B+ liquidations in one day. Here’s how to save your portfolio.
Bitcoin climbed to about $126,000 in October 2025 before falling to roughly $60,000 by early February 2026.
The decline erased about $2 trillion in market value and forced more than $1 billion of liquidations within 24 hours at the height of selling.
Exchanges recorded sharp spikes in trading volume, while leveraged positions closed at a rapid pace.
Institutions also adjusted exposure through ETF outflows, and on-chain activity showed declining speculative participation.
During the selloff, we tracked a set of signals that revealed when panic selling intensified and when selling pressure began to slow.
RECOMMENDED: Why Did Bitcoin Crash? – The Secret Trigger Most Traders Missed
1. Funding Rates And Open Interest Show When Leverage Breaks
Funding rates help traders understand market sentiment in real time.
During the decline, several major exchanges saw funding rates shift from positive to negative for multiple sessions.
At the same time, open interest fell more than 10% within 48 hours during the most aggressive selling phases.
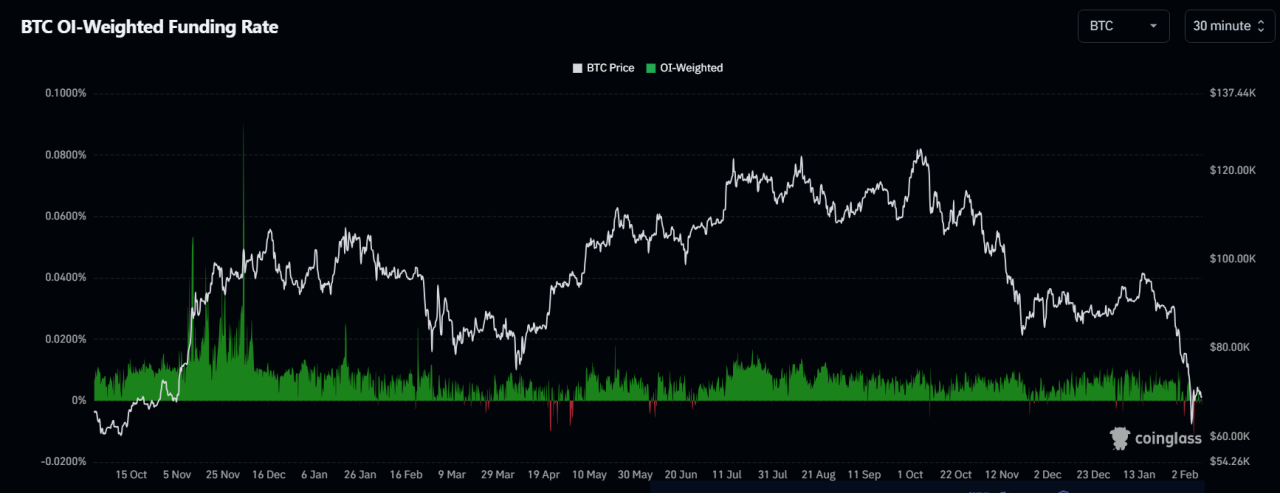
These two indicators show that leveraged longs closed positions quickly, and forced liquidations accelerated price drops.
Traders who follow this signal reduce risk until funding stabilizes and open interest stops falling.
When both indicators begin to recover together, it often signals the first stage of price stabilization.
ALSO READ: Bitcoin Crashes to $60,000 in Minutes -The $2.6B Panic Nobody Saw Coming
2. Exchange Inflows Reveal When Sellers Prepare To Exit
Blockchain data showed sharp increases in bitcoin moving onto exchanges during the heaviest selloffs.
In some sessions, daily inflows doubled compared to normal activity levels.
When traders transfer coins to exchanges, they usually prepare to sell or hedge.
Exchange reserves also stopped declining during the downturn, reversing a long accumulation trend that had supported earlier gains.
A sudden increase in exchange balances often precedes price drops because additional liquidity becomes available for selling.
You can use this signal to avoid entering positions too early during periods of rising inflows.
3. Options Market Fear Signals High Volatility
Options data revealed growing fear before the steepest price drops.
One month put/call ratios rose above 1.2 during several sessions, showing increased demand for downside protection.
At the same time, large clusters of open interest formed around major strike prices.
When expiry approaches, market makers hedge positions by selling spot bitcoin, which adds extra selling pressure.
This effect increases volatility and creates sharp price swings around expiry dates.
So, if you monitor options flow, you’ll understand when volatility may increase and when price movements may accelerate unexpectedly.
RECOMMENDED: Is Bitcoin Finished? Washington Rejects Bailout As Price Plummets
4. On-Chain Activity Shows Who Is Selling And Who Is Holding
On-chain metrics revealed a clear divide between short-term traders and long-term holders.
Short-term holder MVRV fell deep into negative territory, indicating that recent buyers held positions at a loss.
Daily active addresses also declined during the downturn, showing reduced speculative activity.
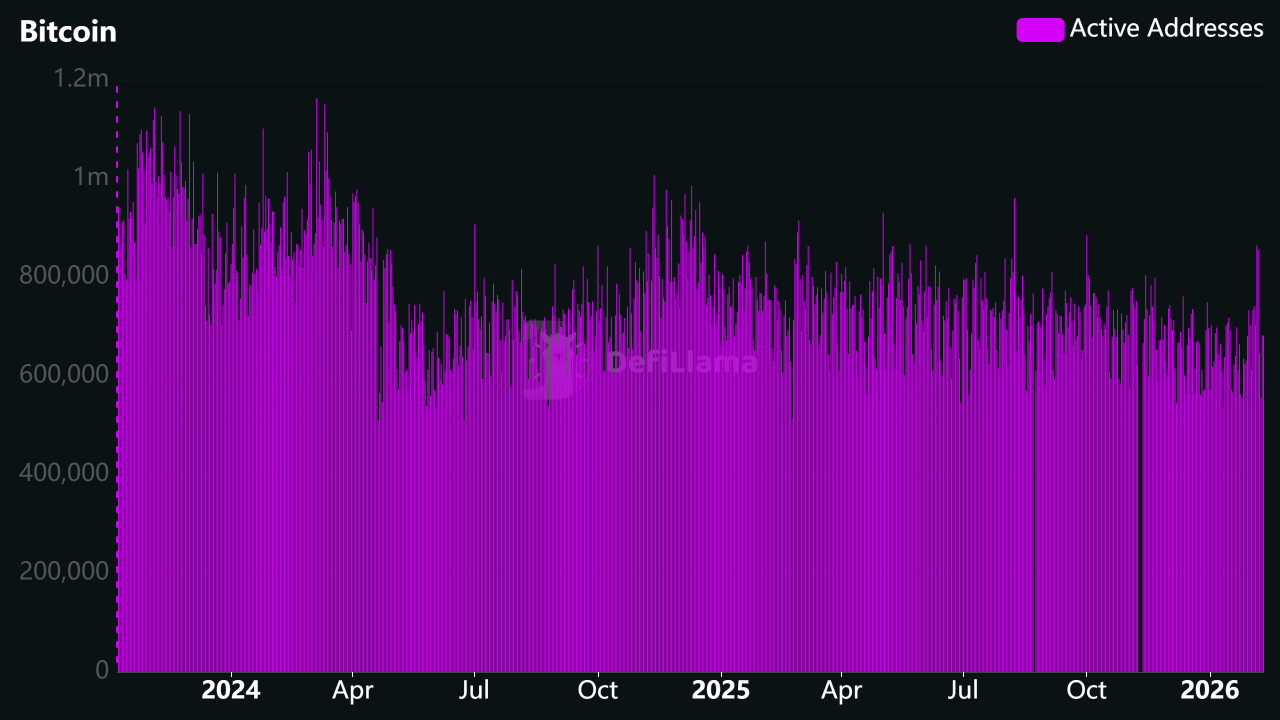
However, long-term holder balances remained stable and in some periods increased slightly.
This pattern suggests that experienced investors accumulated during periods of heavy selling.
This signal will help you determine whether a selloff reflects panic or a longer structural decline.
5. ETF Flows Show Institutional Demand Weakening
Institutional activity changed sharply before the deepest part of the drop. Spot bitcoin ETFs shifted from strong inflows to sustained outflows over several weeks.
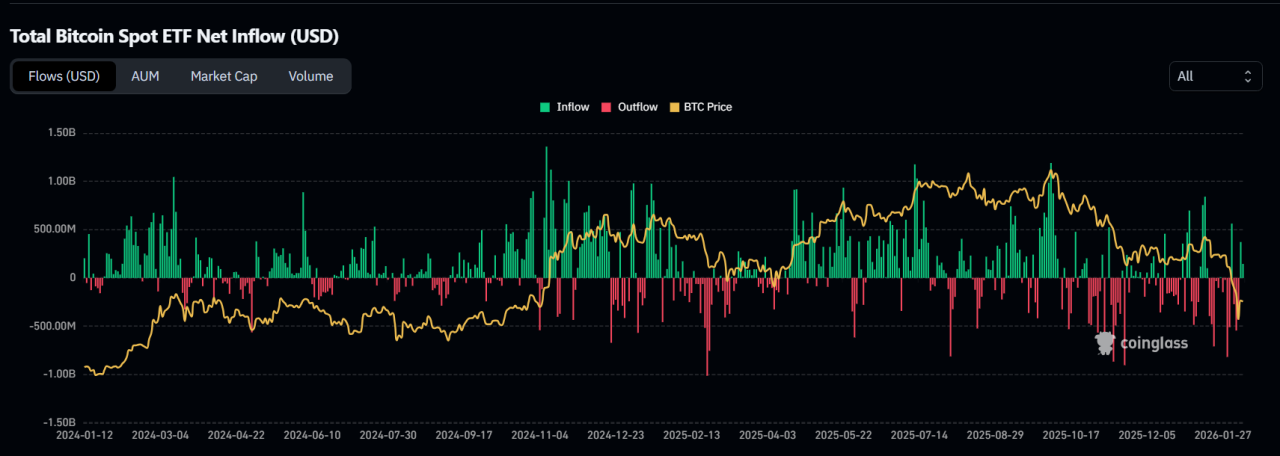
Weekly flow data showed billions leaving funds during periods of heavy selling pressure.
Custody desks reported rebalancing activity that required selling bitcoin exposure.
When ETF flows turn negative while other risk signals appear, markets often experience extended periods of weakness rather than quick recoveries.
You should monitor ETF flows because institutional demand plays a large role in overall market liquidity and price stability.
YOU MIGHT LIKE: Liquidation Rebooted Bitcoin – Mega Rally Hiding in Plain Sight?
Conclusion
The fall from $126K to $60K revealed signals that traders could measure in real time.
Funding stress, exchange inflows, options fear, weak on-chain activity, and negative ETF flows each showed growing pressure across the market.
If you combine these signals and manage risk carefully, you will gain a better view of when panic peaks and when disciplined entries become possible.
Should You Invest In Bitcoin Now?
Before you invest, you’re going to want to read our next premium crypto alert which will be published in the coming days. We will reveal key crypto assets to consider in 2026 with explosive potential.
Read our latest alert here: A Harmonic Setup in BTC Indicates a Bottoming Area Is Forming(Feb 8th)
Since 2017, InvestingHaven’s blockchain research service has been guiding investors through both bull runs and crypto winters.
Best Crypto Exchange for Intermediate Traders and Investors
Invest in cryptocurrencies and 3,000+ other assets including stocks and precious metals.
0% commission on stocks - buy in bulk or just a fraction from as little as $10. Other fees apply. For more information, visit etoro.com/trading/fees.
Copy top-performing traders in real time, automatically.
eToro USA is registered with FINRA for securities trading.
30+ million
Users worldwide

