
Bitcoin keeps hitting $70k and pulling back because buying pressure weakens at that level. ETF flows, exchange supply, and chart signals explain why the breakout has not stuck.
Bitcoin is trading around 67058.11 today after another failed attempt to push above $70,000. Recent reports show that spot Bitcoin ETF inflows have cooled compared to earlier in the rally.
At the same time, exchange inflows increased, which means more coins are available to sell. When you combine these factors with the current chart structure, the repeated rejection at $70k stops looking random.
Bitcoin Price Prediction
Visualize future value based on annual growth.
RECOMMENDED: Bitcoin’s Fall From Grace: 5 Secret Signals To Turn Panic Into Profit
Bitcoin Chart Analysis: Clear Resistance At $70K
Bitcoin has tested $70,000 several times over the past weeks, yet it has failed to close decisively above it. Each attempt produced a long upper wick on the daily candle. That pattern shows sellers stepping in aggressively once price trades above that level.
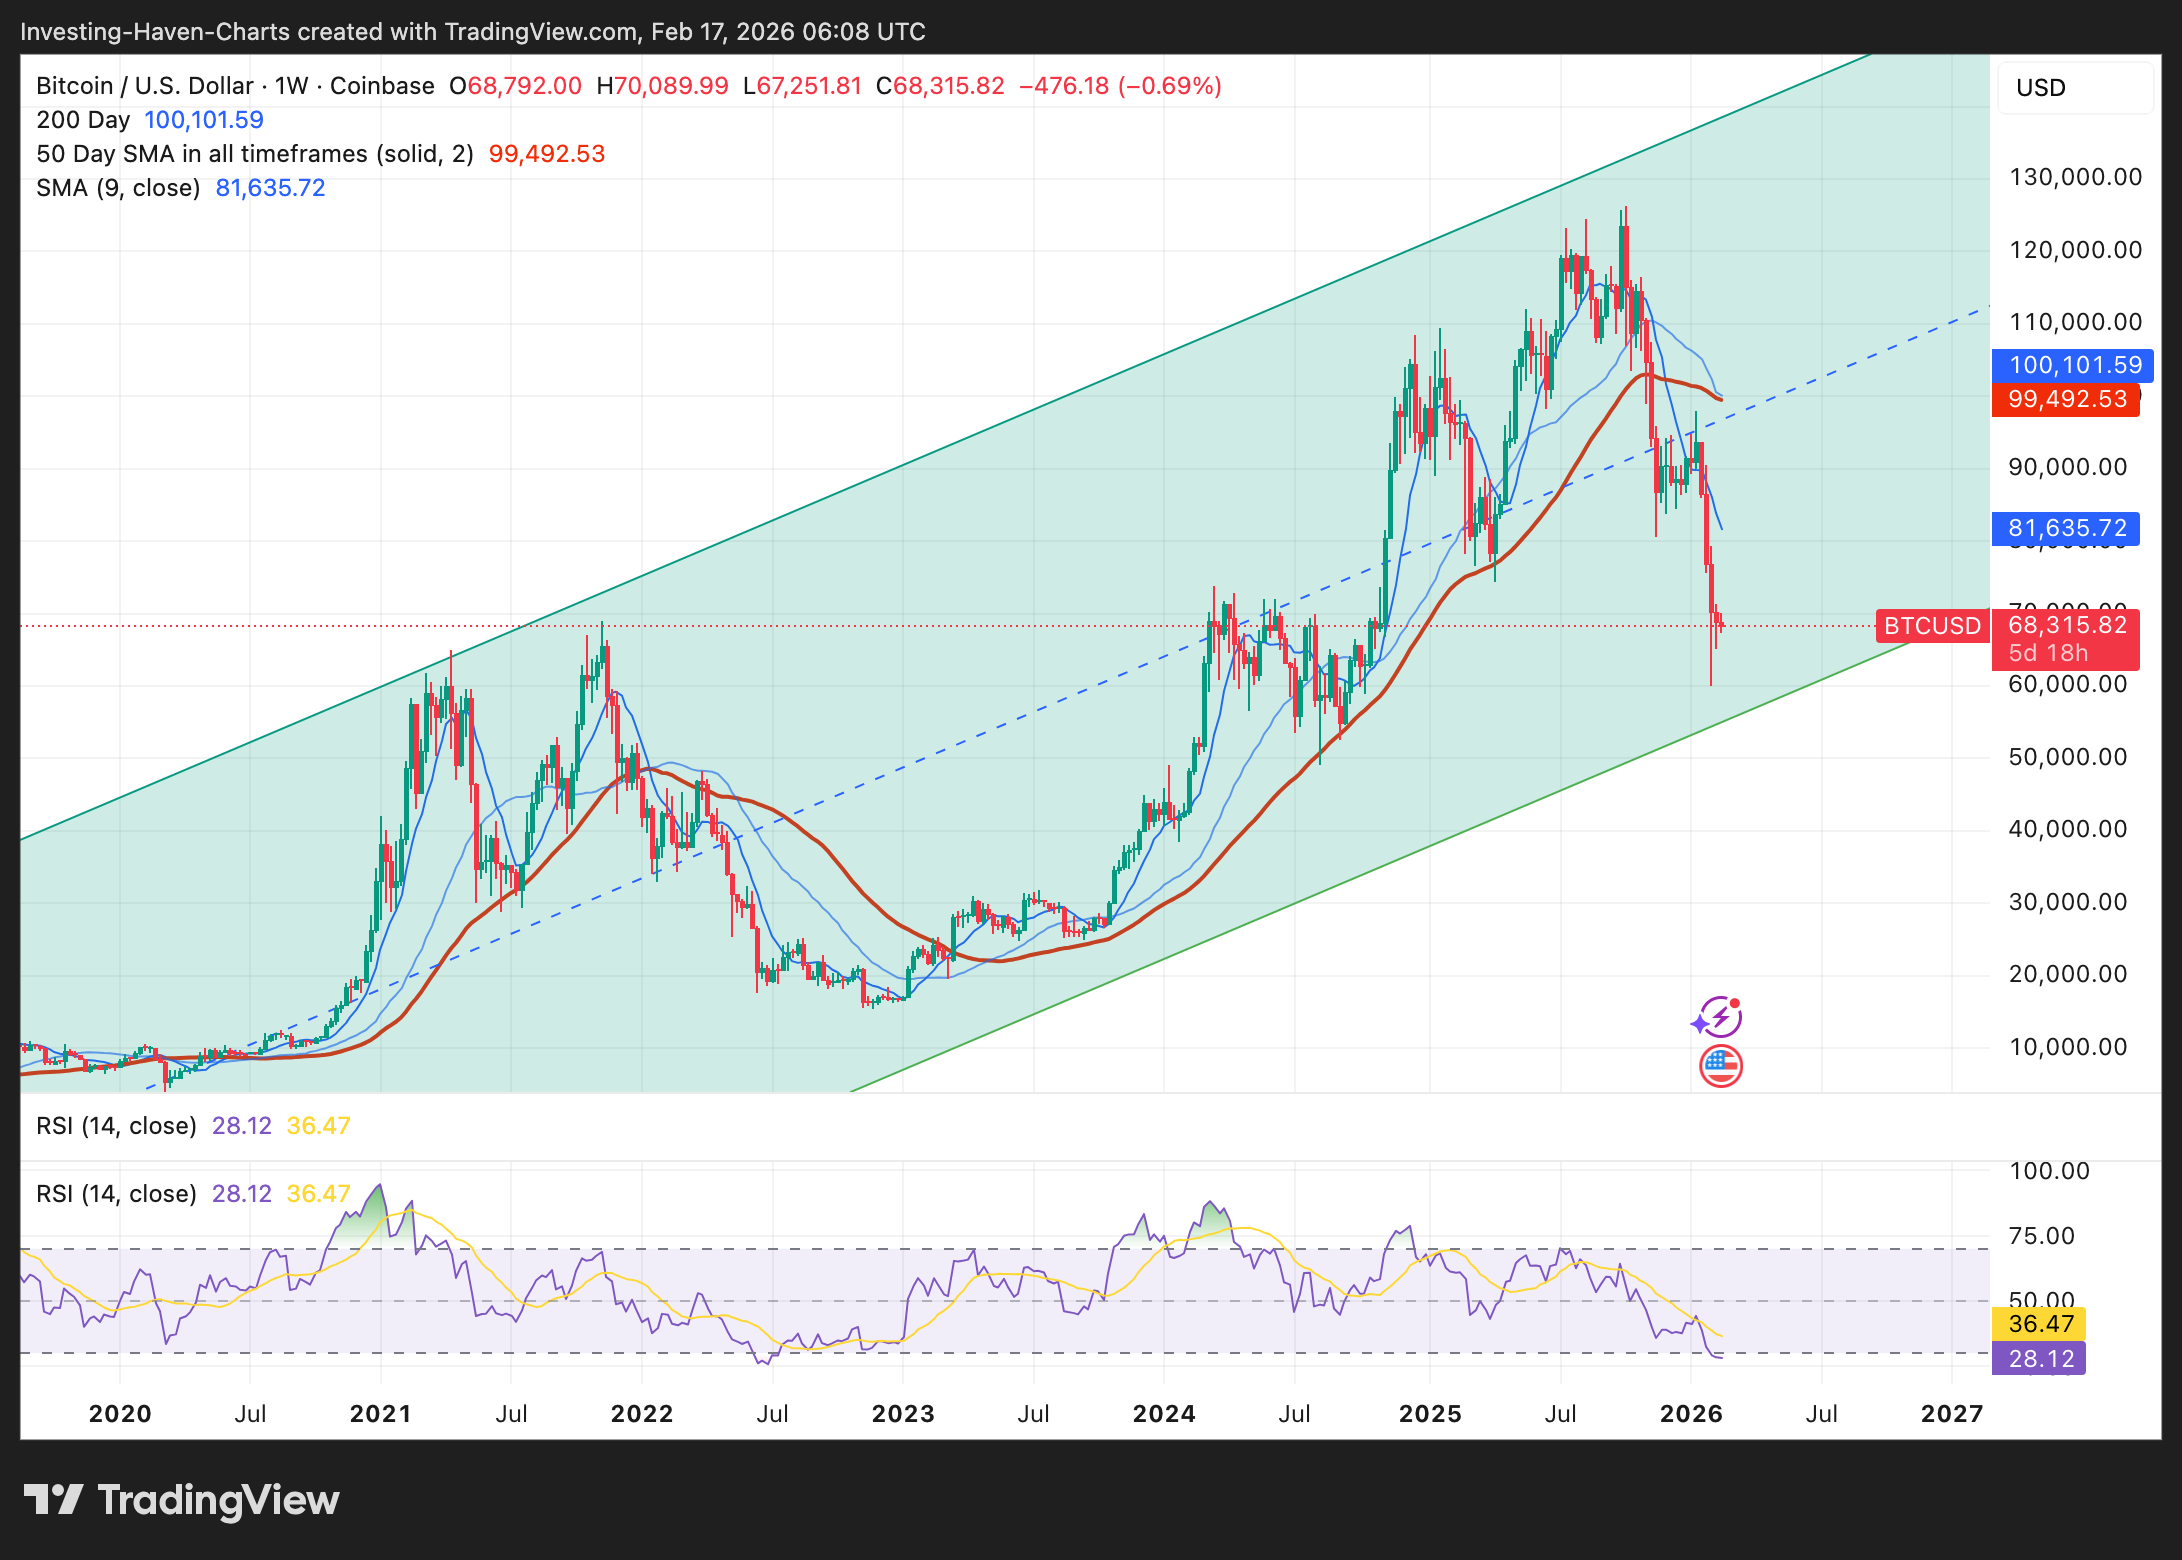
Rally attempts toward $70k have often occurred on lighter volume, while pullbacks printed stronger volume spikes. When volume expands on declines but shrinks on advances, buyers do not control the move.
On the other hand, the Relative Strength Index on the daily chart has not made new highs during recent tests of $70k. On lower timeframes such as the 4-hour chart, momentum fades quickly once price approaches resistance.
This combination of repeated rejection, weak volume support, and soft momentum creates a ceiling that traders respect.
Until Bitcoin closes above resistance with strong participation, the level remains intact.
ALSO READ: Michael Saylor Just Pledged To Buy Bitcoin Forever Despite A $12.4 Billion Loss
Bitcoin ETF Flows: The Missing Buyer
Spot Bitcoin ETFs played a key role in the earlier rally. Large inflows translated into consistent buying pressure in the underlying market. This steady demand helped absorb selling and pushed price higher.
Recently, however, ETF flows turned inconsistent. Some sessions showed sizable net outflows, including a $410 million outflow day across major funds. When ETF flows slow or flip negative, the market loses a dependable buyer. Without that constant demand, breakouts become harder to sustain.
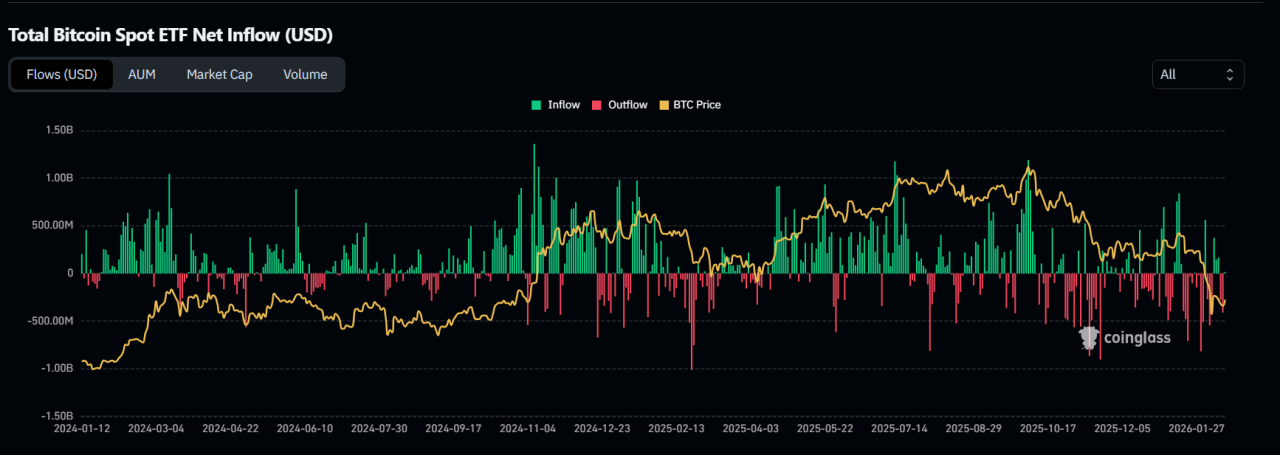
This shift does not mean institutional interest disappeared. It means the flow is no longer one-directional. When ETF buying pauses while price approaches resistance, the market struggles to push through.
At $70k, that absence becomes obvious. Buyers try to lift price, but without strong ETF support, the move fades.
Exchange Inflows And Overhead Supply
Recent data shows increased Bitcoin inflows to exchanges. When more coins move onto exchanges, potential sell supply rises.
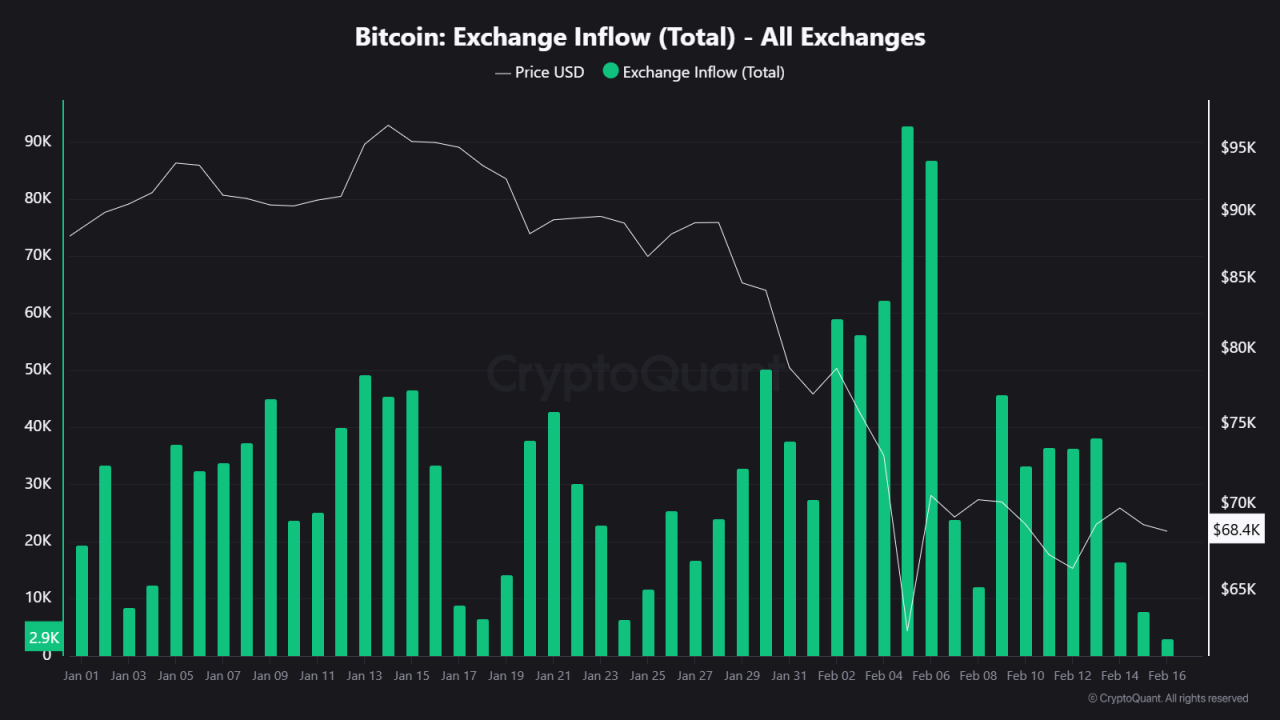
Many of these coins sit in the $66k to $72k range. Traders who bought at higher prices often look to exit at break-even or small profit when price returns to their entry level. That behavior creates overhead supply.
Overhead supply acts like a wall. As Bitcoin approaches $70k, sell orders stack up from traders eager to reduce risk. The market must absorb that supply before it can move higher. If buying volume is not strong enough, price stalls.
Derivatives markets reflect caution as well. Funding rates have not stayed strongly positive, and open interest has not expanded aggressively during breakout attempts. This shows traders are not fully committing to upside bets.
YOU MIGHT LIKE: Bitcoin Miners Built a $77K Price Floor – Are We on the Cusp of a Miner-Fueled Bitcoin Rebound?
What Needs To Happen For A Real Breakout
A clean breakout above $70k requires alignment across several factors.
First, Bitcoin needs a strong daily close above $72k on high volume. A brief spike is not enough. The close matters because it shows buyers held control through the session.
Second, ETF flows must turn consistently positive over multiple days. Sustained inflows would reintroduce steady demand.
Third, exchange balances should decline. Falling exchange supply signals that holders prefer custody over selling, which reduces overhead pressure.
If these conditions align, the resistance zone weakens. Without them, the market likely remains stuck in a range.
ALSO READ: Why Did Bitcoin Crash? – The Secret Trigger Most Traders Missed
Conclusion
Bitcoin keeps failing at $70,000 because the market lacks steady demand at that level. ETF flows have cooled, exchange supply increased, and the chart shows repeated rejection patterns.
The level will break when strong volume, sustained ETF inflows, and falling exchange balances work together. Until then, $70k remains a technical ceiling that traders cannot ignore.
Should You Invest In Bitcoin Now?
Before you invest in BTC, you’re going to want to read our next premium crypto alert which will be published in the coming days. We will reveal key crypto assets to consider in 2026 with explosive potential.
Read our latest premium crypto alert here: Bottoming Patterns Everywhere?(Feb 15th)
Since 2017, InvestingHaven’s blockchain research service has been guiding investors through both bull runs and crypto winters.

