Goldman disclosed $153M in XRP exposure just as the token fell 11% intraday. On-chain data shows heavy transfers and thinner liquidity helped turn selling into a fast cascade.
Goldman Sachs reported roughly $153M in XRP exposure this quarter. Not long after, XRP dropped about 11% in a sharp intraday slide before finding some support.
Around the same time, blockchain data showed close to 50M XRP moving into selling channels in less than 24 hours.
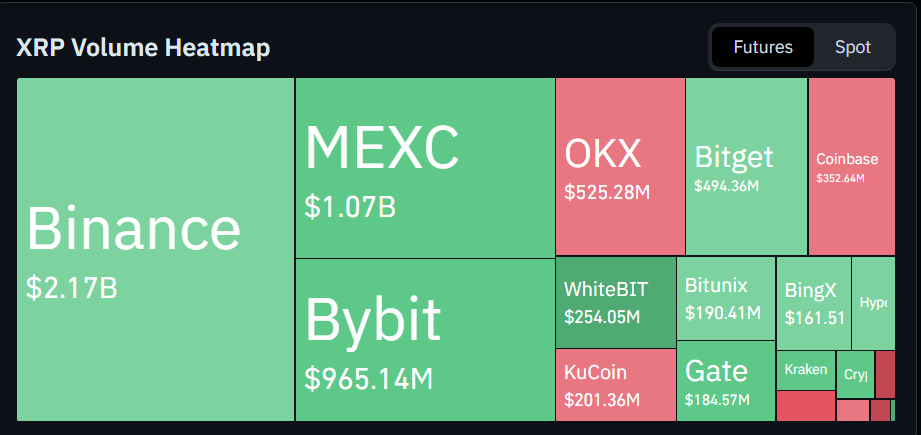
Exchanges also saw about 192M XRP withdrawn over two days. But what exactly caused this sudden drop?
XRP Price Prediction
Visualize future value based on annual growth.
RECOMMENDED: Analysts Warn XRP Could Crash to $0.85 – Should You Be Worried?
What Happened To XRP Today?
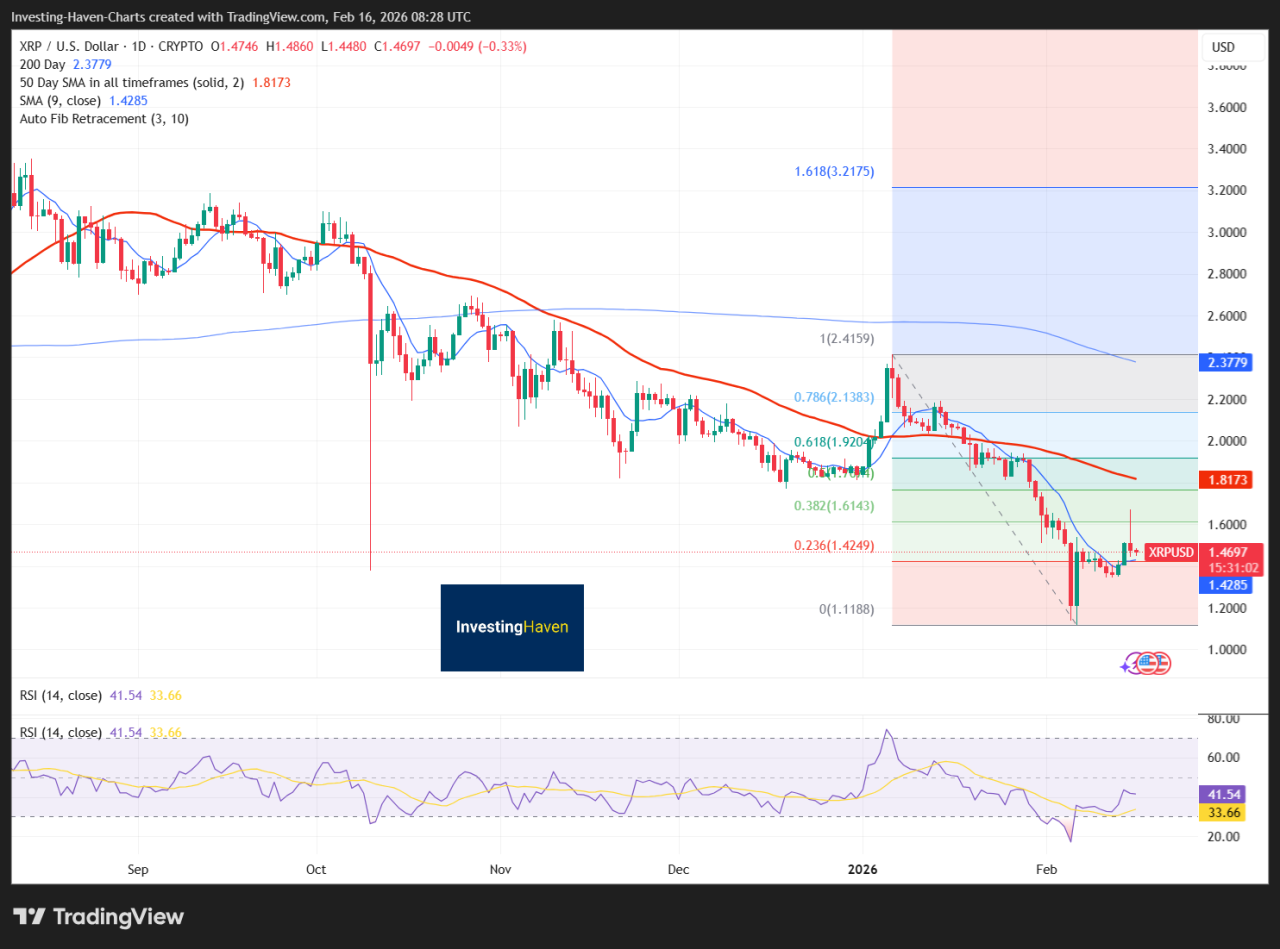
Blockchain trackers picked up several large transfers linked to exchange wallets. Soon after, short time-frame charts showed sharp red candles stacking on top of each other. XRP slid roughly 11% from the session high to the intraday low before stabilizing.
When large amounts of tokens move onto exchanges, it often signals intent to sell. Reports show about 50M XRP flowed into selling channels in less than a day. While this alone does not guarantee a crash, the timing might have.
At the same time, exchanges recorded net withdrawals totaling roughly 192M XRP over two days. This is easy to overlook, but it is important. When tokens leave exchanges, the visible supply sitting in order books shrinks. With less liquidity available, big sell orders push price down faster.
As price fell through obvious support levels, stop-loss orders began triggering. Futures traders who were over-leveraged saw their positions liquidated. Each forced sale added more downward pressure. What started as heavy selling quickly turned into a chain reaction.
ALSO READ: Hidden XRP Demand: Payment Flows Behind the Scenes
How Big Is Goldman’s $153M Position Really?
The number sounds large, and it is. A $153M position signals serious institutional exposure. It shows that major Wall Street players are willing to allocate real capital to XRP.
But can this actually cause a crash?
XRP trades billions of dollars in volume on active days. A $153M exposure, especially when structured through filings and ETF-related vehicles, is unlikely to hit the market as one massive sell order.
Institutions typically rebalance positions gradually or through structured mechanisms. If ETF redemptions or portfolio adjustments took place, they would contribute to sell pressure. But they would not automatically overwhelm global liquidity on their own.
It is more realistic to see Goldman’s disclosure as a background factor rather than a direct trigger.
So, What Caused The 11% XRP Drop?
To understand why XRP price dropped suddenly, we need to look at on-chain data.
First, about 50M XRP was sold or positioned for sale in a short time frame. Concentrated activity like that creates pressure, especially when liquidity is not deep.
Second, the roughly 192M XRP withdrawn from exchanges reduced the cushion of buy orders that usually absorbs selling. Thinner books mean larger price swings.
When these two forces meet, price reacts quickly. A few large orders can break through support levels. Once that happens, automated systems kick in. Stop losses fire. Margin positions unwind. Liquidity providers widen spreads. The move accelerates.
This pattern does not require a single institution to intentionally crash the market. It only requires concentrated selling meeting limited liquidity at the wrong moment.
YOU MIGHT LIKE: What Falling XRP Exchange Balances Could Signal for Future Prices
What This Means Going Forward
Institutional exposure like Goldman’s can increase attention and sensitivity around a token. But price crashes usually come from how orders interact with liquidity, not from one name attached to a filing.
For traders, large exchange deposits are early warning signs. Sudden drops in visible order-book depth are another. When both appear together, risk rises.
Position size also becomes critical in fast markets. Even experienced traders get caught when leverage meets thin liquidity. Markets can move further and faster than most expect.
XRP’s rebound after the drop shows that buyers are still active. But the sell-off reminds us that liquidity conditions can change quickly. When they do, even moderate selling can turn into a sharp slide.
ALSO READ: When To Buy XRP? This Chart Might Help
Conclusion
Goldman’s $153M XRP exposure is significant and signals institutional involvement. But the data suggests today’s 11% drop was not caused by one Wall Street decision.
Instead, heavy token transfers, reduced exchange liquidity, and cascading liquidations combined to amplify the move. In crypto markets, timing and liquidity often determine how far price travels. Today’s sell-off fits that pattern.
Should You Invest In XRP Now?
Before you invest in XRP, you’re going to want to read our next premium crypto alert which will be published in the coming days. We will reveal key crypto assets to consider in 2026 with explosive potential.
Read our latest premium crypto alert here: Bottoming Patterns Everywhere?(Feb 15th)
Since 2017, InvestingHaven’s blockchain research service has been guiding investors through both bull runs and crypto winters.

