
One year ago, the dominant question when the Nasdaq would sell off. Today, many investors are asking when the Nasdaq will it all-time highs. Sentiment is certainly not overly bullish. That’s a good thing from a contrarian perspective. We believe it is the right question to ask, and we will provide our viewpoint in this article. In sum, we believe we have 3 dates when the Nasdaq might hit all-time highs, one date in 2023 and two dates in the first part of 2024.
One of the most important assumptions behind this Nasdaq forecast is the absence of a Secular Bearish Turning Point In 2023. We do not expect a bearish turning point, one that will mark the end of the ongoing uptrend in the Nasdaq, not any time soon.
Another one is based on one of the few charts & indicators that truly matter in 2023 & beyond: Which Is The Single Most Concerning Chart For Investors In 2023 & 2024.
When we talk about a secular turning point, we refer to a bearish turning point similar to the one in 2007 or 2000, one that introduced a market crash. We don’t see a stock market crash in 2023 for reasons outlined in multiple articles on our site.
The Nasdaq and All-Time Highs: Why Does It Matter?
Will the Nasdaq carve its path to new all-time highs in 2023 or 2024?
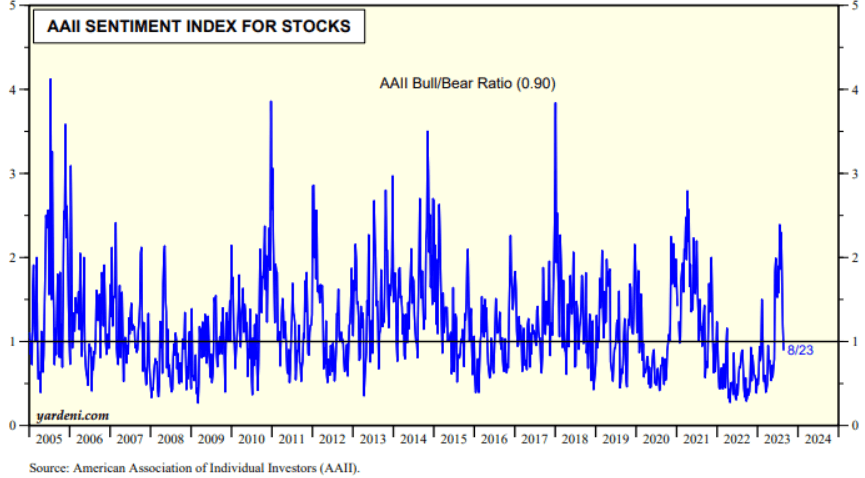
If anything, if we look at sentiment, we are certainly delighted to see a steep drop in the bull/bear ratio, as we head into the seasonally weaker month of September. The pre-requisite for a market to hit new highs is certainly not extreme bullish levels.
The bull/bear ratio went up a lot over the summer of 2023, it dropped enough to fuel a year-end rally.
The Nasdaq tends to take leadership when markets move higher. So, it matters to understand the future direction of the Nasdaq, simply because it tends to coincide with the future direction of broad markets.
Nasdaq’s Leading Indicators Suggesting Nasdaq Will Set New All-Time Highs
In the realm of market forecasting, leading indicators emerge as the North Star guiding us through a confluence of trends, sometimes even conflicting trends. These indicators, often antecedent to market movements, hold a key to deciphering the future trajectory of assets. Their significance lies in the insights they offer into potential market shifts, providing a vantage point for informed decision-making.
Now, let’s highlight the three leading indicators that stand as beacons suggesting a favorable path for the Nasdaq over the forthcoming nine months.
1. Monetary Tightening Signals Nearing End
Amidst the uncertainties conveyed by policy makers, a noteworthy indicator has emerged: the exact data points that Federal Reserve is tracking to understand if/when they will end monetary tightening. This shift in course is subtly reflected in the rates that have been sending signals. The diminishing vigor of tightening suggests a potential recalibration in the market dynamics, paving the way for a more accommodative environment.
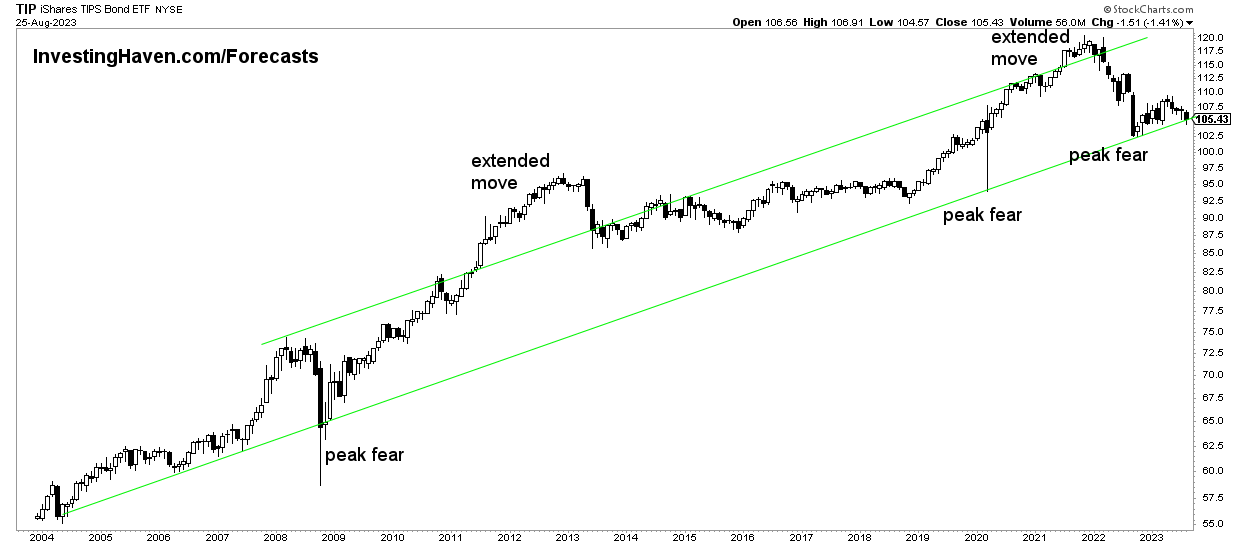
2. TIP ETF: Respecting the Uptrend
The TIP ETF has stood out as an indicator worth observing. With an eye on inflation expectations, this ETF has shown remarkable adherence to its uptrend. This alignment could spell promising prospects for risk assets like stocks. A chart of TIP ETF, showcasing its upward trajectory, provides a visual testament to this trend.
3. The Nasdaq Chart: A Long-Term Channel
Zooming in on the Nasdaq’s own chart, a striking feature emerges – a long-term rising channel that has held its dominion. This channel, etched over time, symbolizes the prevailing trend. The chart’s enduring adherence to this trajectory, shown below, underscores the resilience of the bullish momentum within the Nasdaq’s realm.
These three leading indicators suggest a long term bullish outcome.
Each indicator paints a fragment of the bigger picture, hinting at a trajectory that could steer the Nasdaq towards new heights. As we delve deeper into the details of each indicator, their collective chorus may well hold the answer to our question: Will the Nasdaq ascend to all-time highs in 2023 or 2024?
Analyzing The 10-Year Nasdaq Chart
Let’s dissect the Nasdaq charts, starting with the 10-year chart.
The dominant long term trend is crystal clear. While we cannot know, with certainty, whether the Nasdaq will touch the top of this long term channel, we certainly an see that the ongoing bullish reversal respected the long term uptrend. This suggests that all-time highs will be hit, either in 2023 and/or in 2024.
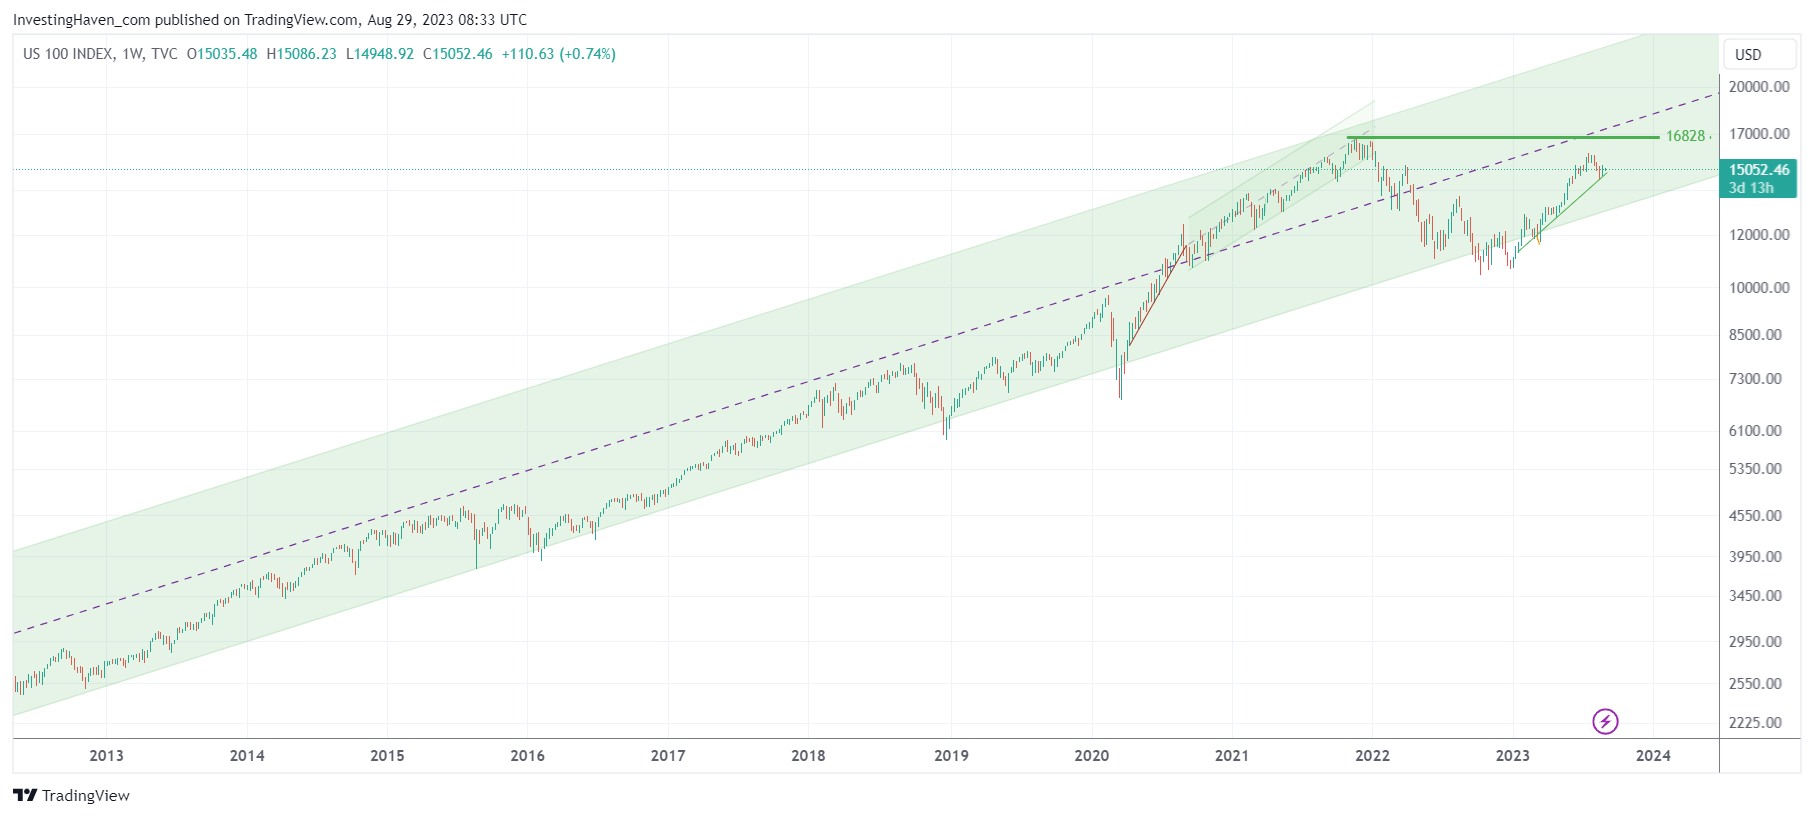
The structure and dominant pattern of this chart resonates with the leading indicators we explored earlier. As monetary tightening’s potency recedes, the Nasdaq’s alignment with this upward channel gains relevance. The waning influence of tightening dovetails with the Nasdaq’s trajectory, hinting at a potential synchronization between these factors.
Analyzing the 20-Year Nasdaq Chart
Let’s delve into the 20-year Nasdaq chart. An intricate pattern on this long term chart is the monumental “W” reversal in the period 2000-2013, one that was so powerful that it was able to push the Nasdaq higher for many years in a row.
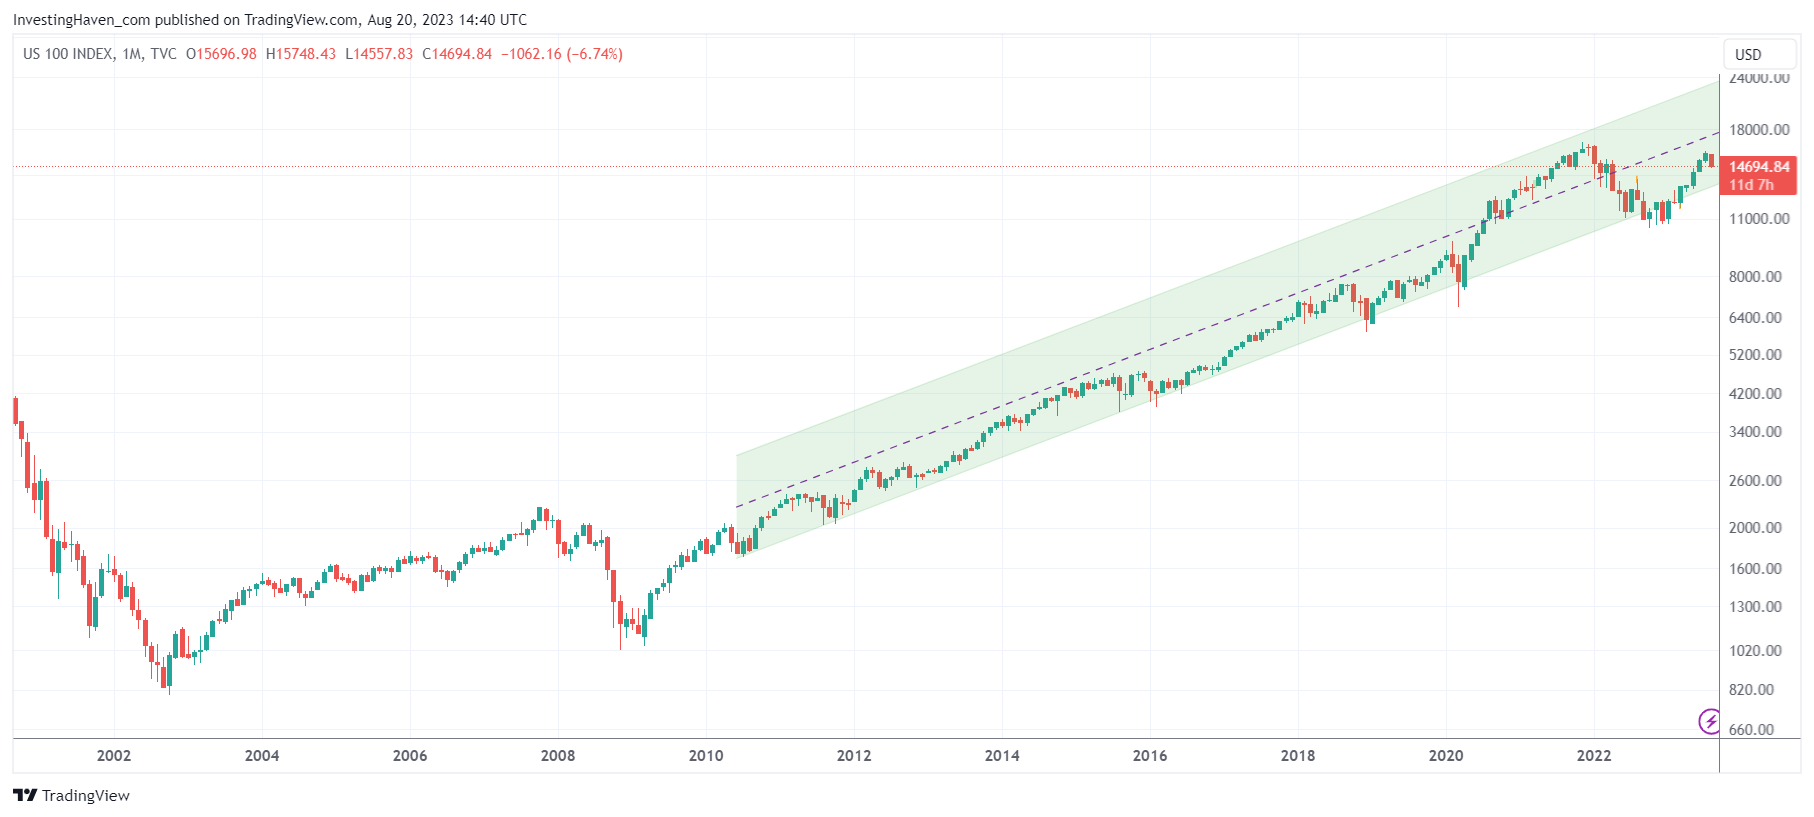
The aftermath of the “W” reversal is marked by a decade-long uptrend. Beyond numbers, this trend signifies the resilience of market forces and the ability to not just bounce back, but to soar to new heights.
Nasdaq All-Time High Forecasting Scenarios: 2023 vs. 2024
With the charts as our compass and proprietary timeline analysis as our guide, let’s explore the two potential timeframes where the Nasdaq could potentially embrace new all-time highs: 2023 and 2024. Here, precision merges with projection, as we bring a timeline analysis into the equation.
Scenario 1: Mid-December 2023 or Mid-February 2024
In this scenario, our focus is set on two critical junctures: mid-December 2023 and mid-February 2024. These timeframes emerge as pivotal windows, wherein the Nasdaq may orchestrate its ascent to new heights. The possibility of hitting all-time highs in December might be followed by a tactical pullback, setting the stage for a subsequent new high either in February or April 2024.
Scenario 2: A Gradual Climb to Mid-April 2024
The second scenario paints a slightly more prolonged trajectory. Here, the Nasdaq could embark on a gradual ascent, with a local top anticipated in mid-April 2024. This pathway envisions a steadier climb. The timeline analysis suggests that this methodical progression aligns with the underlying currents of the market landscape.
As we analyze these potential scenarios, the interplay between our charts and the insights drawn from our proprietary timeline analysis paints a comprehensive picture.
The Invalidation Scenario of our Bullish Outlook
One significant facet that could dim the optimism lies in the realm of economic indicators. Imagine a scenario where the economy continues to run at a red hot pace, with unemployment figures consistently low and inflation unable to continue to moderate. This would be a recipe for the Federal Reserve to continue tightening, affecting our bullish narrative.
The month of October 2023 could emerge as the critical juncture, where the clarity of economic indicators could potentially pivot the market’s direction. Our bullish stance is based on an end-of-year rally to start not later than in mid-October 2023.
Conclusion: When Will The Nasdaq Set All-Time Highs
We’ve explored the question: Will the Nasdaq ascend to all-time highs in 2023 or 2024? Our quest led us to review leading indicators, Nasdaq charts, and our timeline analyses.
We’ve taken a deep dive into the signs that point towards the Nasdaq climbing higher. It’s like a musical orchestra of indicators, each playing a different tune that echoes the Nasdaq’s upward push. The way the economy’s tightening and relaxing, the consistent growth in TIP ETF, and the Nasdaq’s historical pattern all paint a picture of hope for the future.
Looking back over the last two decades, we discovered something fascinating. There was a big bounce-back, kind of like a phoenix rising, between 2000 and 2014. This bounce-back continues to remind us that markets have a way of rebounding and going even higher.
We’ve explored two potential timeframes for Nasdaq’s all-time highs: the hope for December 2023 or the possibility of February 2024, maybe even a slow rise to April 2024. Each of these scenarios is a mix of careful analysis and educated guesses.
However, we can’t ignore the unknowns. Among our well-constructed predictions, there’s a possibility of things going the other way. If the economy keeps heating up, it could lead to more tightening, changing the market’s direction. This reminder brings home the fact that markets are made up of many factors.
So, as we wrap up this journey of predictions and forecasts, we do so with our eyes wide open. We know that even the best predictions can be thrown off by unexpected twists. The path to new highs isn’t a straight road but more like a dance between facts and fate, where the Nasdaq’s movements reflect the ups and downs of the financial world.


