
Earlier this year, we identified one particular chart as “The Single Most Important Chart Of 2023.” This chart defied prevalent market crash predictions as its chart pattern was reluctant to break down. This, along with a few other leading indicators, made us predict a bullish 2023 outlook with sector rotations as the dominant market dynamic.
The single most important chart was the TIP ETF, reflecting inflation expectations. Despite 2022’s counterintuitive inflation-expectation decline amid rising inflation, this was attributed to a market preoccupation with disinflationary policies. The article predicted that following historical TIP ETF patterns would trigger upward market and metal trends in 2023.
Indeed, the projection manifested as the TIP ETF held its ascending trajectory, a pivotal precursor to prevent the anticipated market crash. The article highlighted that investor anxiety typically accompanied the trendline approach. While markets were expected to rise gradually, sector rotations were anticipated. Selective investments were emphasized due to non-simultaneous growth prospects.
The conclusion stressed commitment to undervalued high-growth stocks and sectors with promising secular growth cycles. This article, challenging prevailing pessimism and emphasizing the psychological aspect of investing, offered an alternative viewpoint and set the stage for subsequent market trends.
The Single Most Concerning Chart In 2023 & 2024
Let’s review where TIP ETF (Treasury Inflation-Protected Securities) stands.
Note that this ETF is a proxy for gauging inflation expectations in the market. It tends to decline when risk assets are topping (2022), it tends to bottom when risk assets are going through a consolidation (2023).
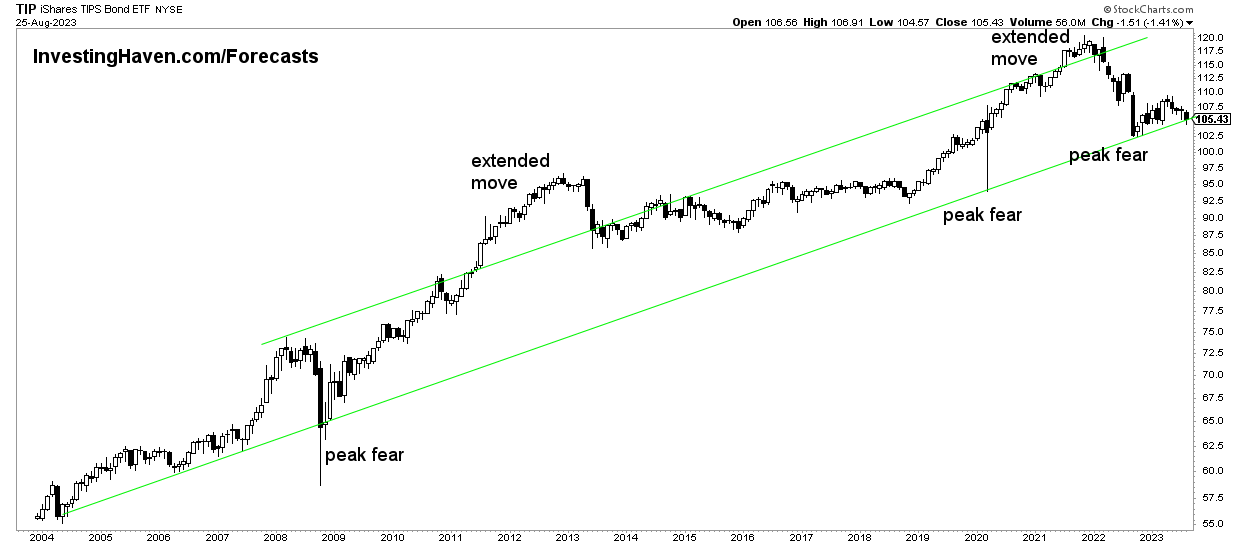
Here’s a breakdown of the 5 key elements in the chart:
- Long-Term Trendline: The chart features a long-term rising trendline that has been a critical reference point. This trendline has historically indicated the market’s perception of inflation trends and central bank policies.
- Inflation Expectations Movements: The line on the chart representing inflation expectations experienced a significant drop throughout 2022. This is despite the backdrop of rising inflation during the same period.
- Key Turning Points: The chart highlights specific instances where the inflation expectations line approached or intersected the long-term trendline. These points often coincide with critical shifts in market sentiment.
- 2023 Outlook: The chart emphasizes that the inflation expectations line managed to maintain its upward trajectory and stay above the long-term trendline, indicating a shift in market sentiment. This suggests that the market perceives a potential end to the tightening cycle of central banks.
- Projection: Based on historical patterns, the chart suggests that if the TIP ETF’s long-term rising trendline holds, this could drive upward movements in both broader markets and metals markets. This projection is contingent on the market’s anticipation of central banks’ policy changes.
In summary, the chart demonstrates how inflation expectations, as reflected by the TIP ETF, play a crucial role in shaping market sentiment. It highlights the importance of the ETF’s long-term trendline and suggests that its movements could act as a leading indicator for broader market trends and metal markets. The chart also underscores the significance of sector rotations and the psychological challenges investors face in navigating these market dynamics.
Conclusions from the TIP ETF chart for 2023 & 2024
As we analyze the chart, it becomes evident that the TIP ETF’s long-term rising trendline acts as a key psychological and technical reference point. This trendline has historically played a pivotal role in guiding market sentiment. Notably, the chart illustrates that during the course of 2022, while inflation was on the rise, inflation expectations paradoxically plummeted. This divergence suggests that the market was predominantly focused on central banks’ disinflationary monetary policies.
What does this chart suggest for 2023 and 2024? The chart implies that, based on historical patterns, the inflation expectations line is anticipated to remain above the long-term trendline. This suggests that the market may perceive an impending end to the era of central bank tightening. This anticipation holds significance as it implies that the falling inflation expectations that have previously exerted downward pressure on risk assets might be in the process of reversing. Therefore, there’s a likelihood that risk assets could be better supported during this period, potentially leading to a more stable uptrend which can only be confirmed if TIP ETF confirms a double bottom in 2022 & 2023.


