Uncertainty in markets is hitting all time highs. Put option activity as a hedge is hitting all time highs. Recession expectations are hitting all time highs. But could this be the most anticipated recessions is not going to materialize? One leading indicator forecasts that a double bottom is in the making in markets. It also suggests that it will confirm whether the double bottom will be dominant in the next one to two weeks.
Here is one thought that we have mentioned throughout 2022 in our premium services: the recession that everyone anticipates is already here but it is hitting markets in a very different way.
In fact, the market is going through rotation in a way never seen before. There is some sort of rolling recession in the economy (h/o Ed Yardeni) which translates to an epic market rotation in markets.
As stated in 7 Secrets of Successful Investing one of the biggest traps when investing in markets is the narrative. At this very point in time, the narrative about the coming recession is so strong that we could argue it is ‘too strong to come true’.
Just to be clear, we are not discounting in any way the risks that dominate the world, the economy, markets. All we are saying is that the charts have the answer, not media. Whenever media is convinced about one specific outcome, it is time to question the narrative.
We look at it differently, in fact. In a way, the recession that ‘everyone’ anticipates is happening and maybe about to complete. That’s how we could read, at present day, one of our leading indicator for markets: the Russell 2000.
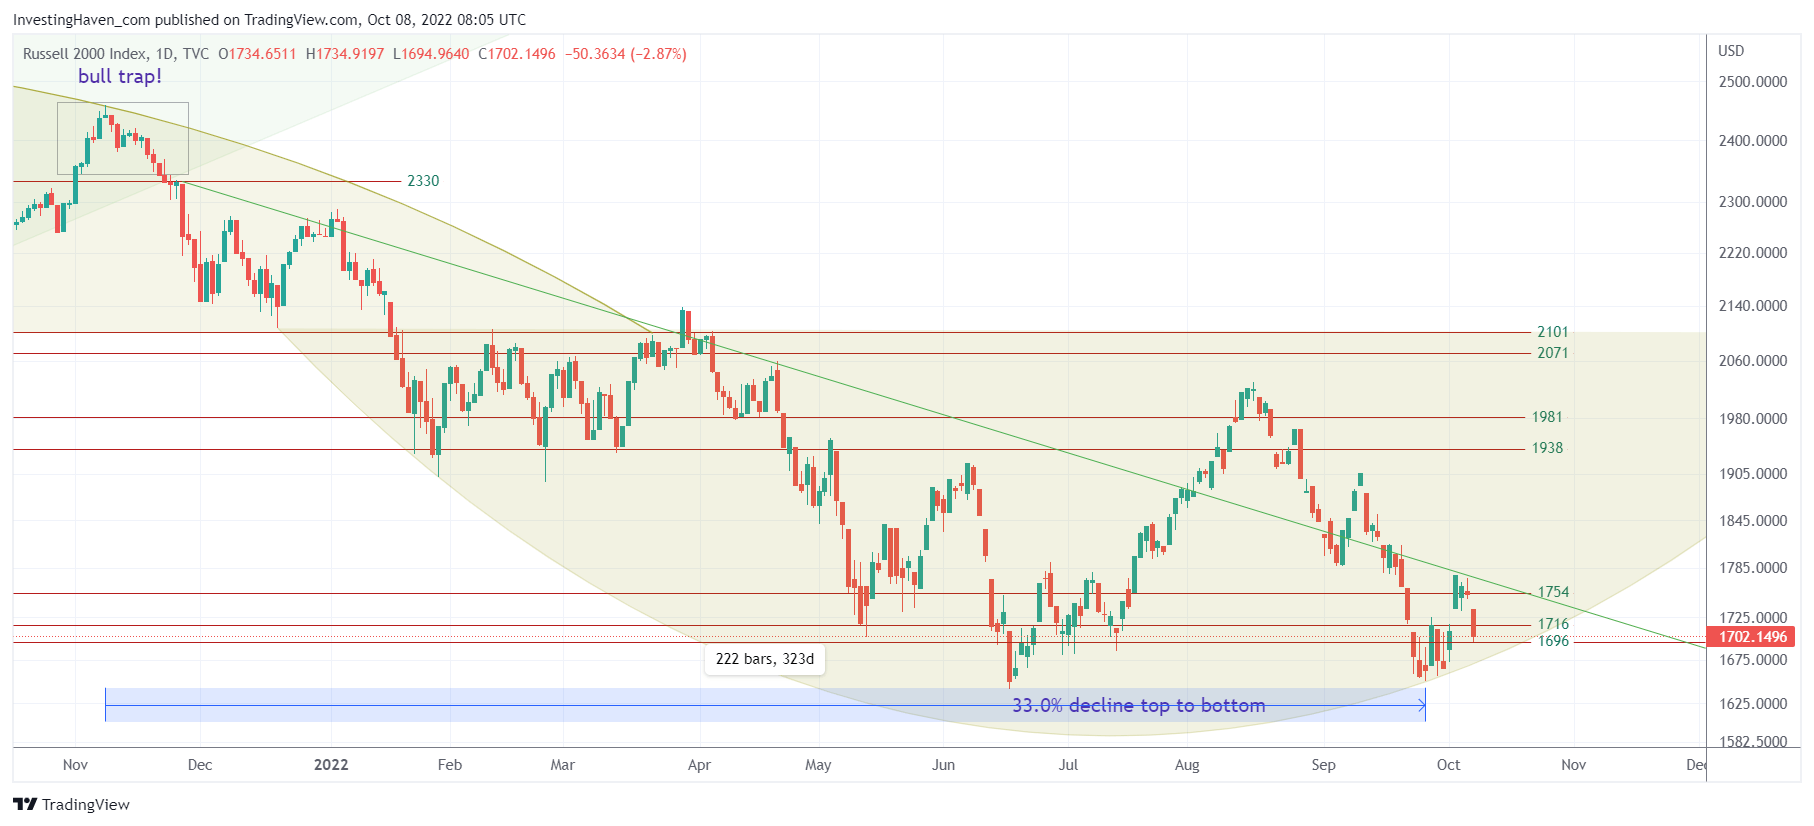
As seen on below chart, the daily Russell 2000, there is a double bottom structure in the making. Similar to the weeks that followed June 17th, the lows of the year in the Russell 2000, there was some violent consolidation that took 4 weeks to complete. Stated differently, we can reasonably expect the market to work for a few more weeks to complete the double bottom.
One data point that might confirm the double bottom set up is the timeline that counts the days since the top was set in November last year. To be more precise, the Russell 2000 hit ATH at the start of what we call the hidden 6 month cycle in markets. Please sign up to Momentum Investing to learn more about this 6 month cycle because it is leading in our methodology. Between then and the lows of Sept 30th, 2022, we count 222 trading bars. This might be powerful enough to confirm a reversal.
The pattern seen on below chart is dominant until it gives up. The Russell 2000 is respecting its June lows, until they give up. For now, benefit of the doubt to the double bottom scenario, until it gives up.
For now, we stay focused on the Russell 2000 chart.


