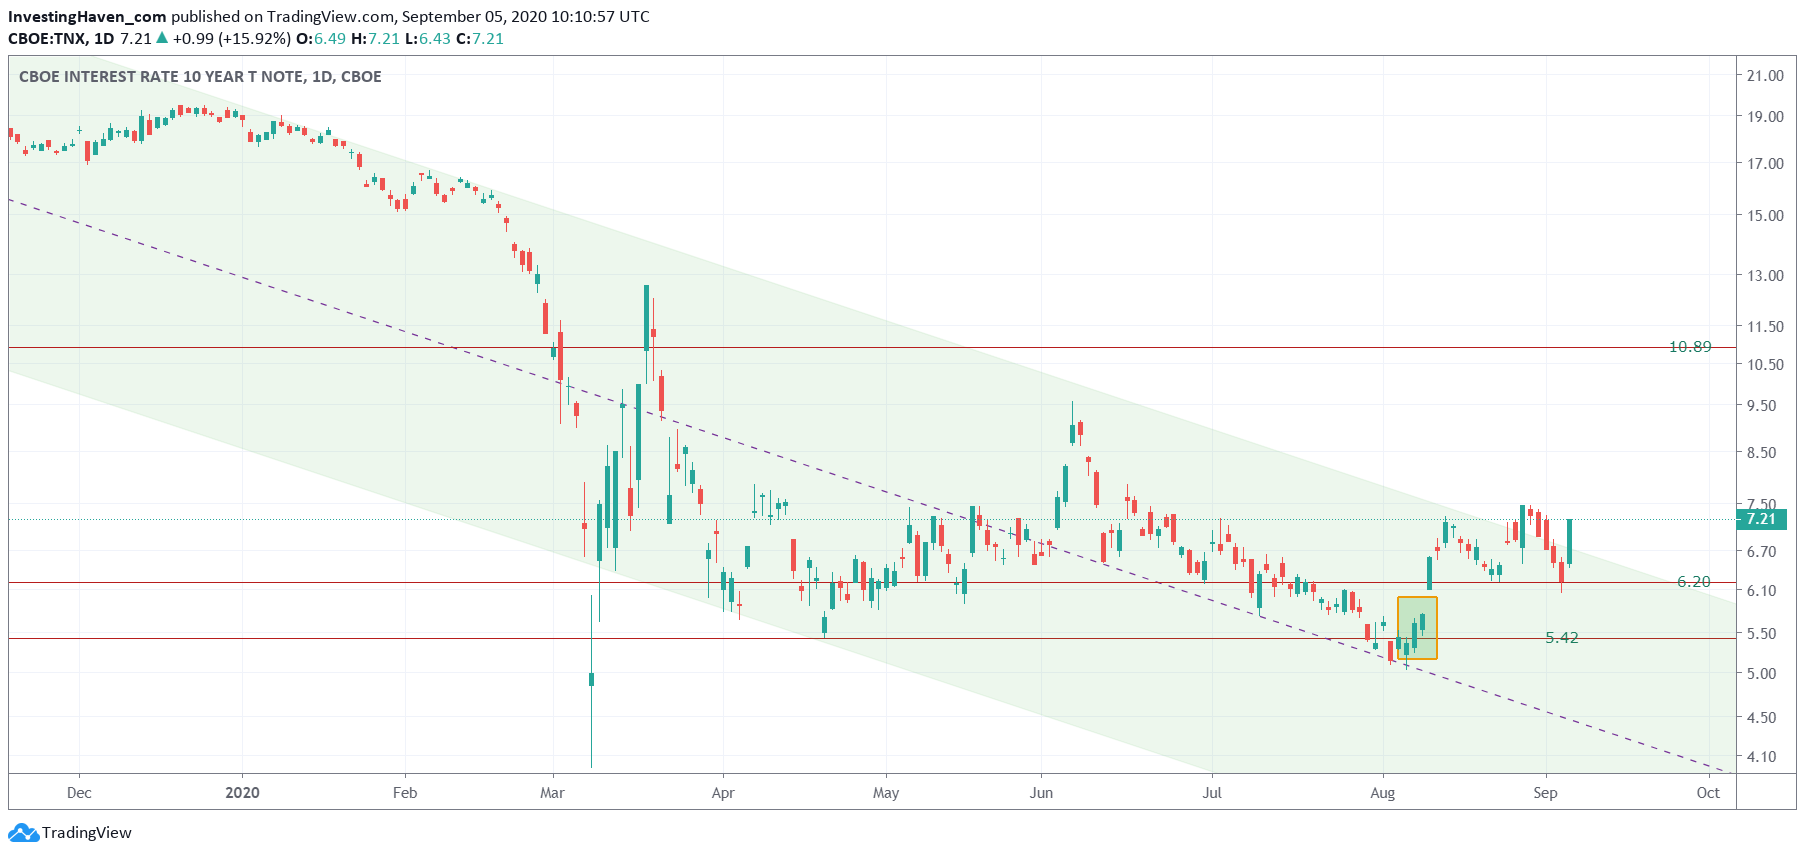
Last week we introduced a Must See Chart which we called The Mother Of All Tops. It was a giant topping pattern in Treasuries. Consequently, interest rates (negatively correlated) should be seeing a giant bullish reversal pattern. That’s indeed what is happening, and we are here to spot this ‘as it happens’. No surprise, we did forecast this particularly to the premium members of our Momentum Investing portfolio, and we are about to take a position in the sector that benefits from this new trend.
Embedded in this article is the daily chart of 10 year Treasuries Notes.
This is a very, very interesting setup, to say the least. Any chartist that looks at this chart will go … hhhmmmm. Well at least the chartists that know how to get the right annotations like channels, price levels and related crucial information right.
That said, we want to share a few critical insights which we get out of this chart.
Assuming readers are willing to simply ‘accept’ from us that this is a wildly bullish looking setup, certainly for the medium to longer term, we can derive a few conclusions from this chart:
- This is a long and consequently strong basing pattern.
- Shorter term, the upside is some 50%.
- Longer term, hard to say but it certainly is much, much more.
- We cannot know (yet) how fast this market will rise. Depending on the speed it will definitely make and break trends in other markets.
- One of the beneficiaries are interest rate sensitive stock sectors.
- One of the victims may be precious metals.
We believe these charts suggest that ‘risk on‘ is here for a while. This suggests stocks will do well, and some particular segments will outperform.


