
Charts are the compass for smart investors. However, the vast majority of investors make this recurring mistake to look after news, and that is a recipe for disaster. This article features a very important investing tip: 2 chart patterns, in particular the long term consolidation and the bullish flag, are the closest you can come to a guaranteed successful setup.
At InvestingHaven, we have reversed the order in which investors work. We focus first on the chart, and only if the chart is approved are looking for additional confirmation in fundamentals and news. Note, as well, that just 1 percent of the news matters, so the trick is to find this one percent relevant news.
That is the guiding principle which is the cornerstone of our methodology, and, as well, our ability to successfully do market forecasts. With this principle in mind, let’s revisit 2 specific chart patterns that immediately, and always, attract our attention: the long term consolidation and the bullish flag. We discuss the 2 chart patterns based on specific cases.
If you would like to evolve in the same direction as our method then please take note that you need to scam hundreds, if not thousands, of charts per week or per month. Only by doing so will you be able to identify the best opportunities out there in terms of low risk / high reward.
Investing Tip: Long term consolidation chart pattern
The long term consolidation pattern is one of our favorites. The saying goes ‘the longer the base the higher space’, and this really an important insight. The longer a consolidation lasts the more upside potential it develops.
What happens during a consolidation phase is interesting: because that specific stock or market is going nowhere investors lose faith and sell their holding. Once all sellers are left, every spark of hope or (fundamental) improvement can result in a strong upside reaction. Moreover, once a breakout takes place, it gets noticed by early buyers who are able to drive prices strongly higher as there are hardly sellers.
One of the most beautiful consolidation setups currently, certainly not the only one, is Qualcomm, multinational semiconductor and telecommunications equipment company.
Recently the stock price of Qualcomm experienced an exodus of confidence due to blocking of Broadcom’s intention to acquire Qualcomm. Be that as it may, Qualcomm experienced a formidable run from 1992 till 2000. Since then price has been consolidating into a triangle for the past 18 years or so.
As long as the price does not break below 48, we consider Qualcomm in a consolidation phase. Note that if 48 fails to hold it will result in a bearish situation.
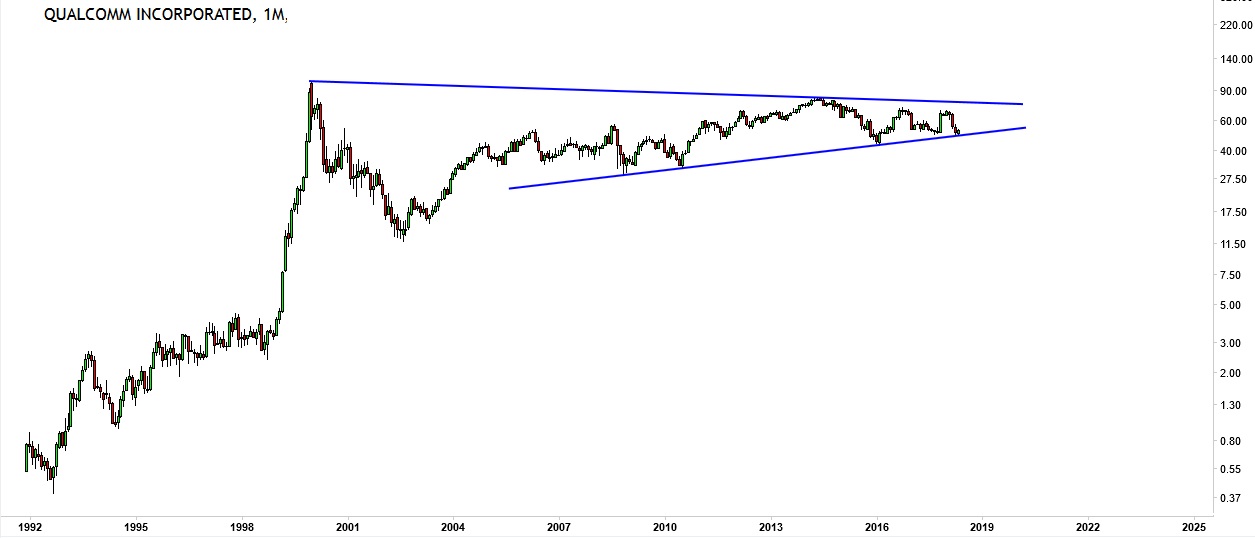
Note that Qualcomm’s price could consolidate a little more before attempting to breach the resistance zone of 70. If the breakout is successful then it will likely break above the triangle downtrend line of 75-77 before challenging 82 as a major breakout point! Once above 82 we talk about a major or secular breakout.
Whether that will take place or not, and if it thappens this year, is not in scope of this article. We just highlight the nature of this pattern, and how to look at downside vs upside potential.
Investing Tip: Bullish flag chart pattern
The second amazing chart setup which we provide as one of the few very important investing tips is the bullish flag. This one is very usual, and it also is a guaranteed pattern for getting the ‘herd’ out of a stock or market.
What happens during a bullish flag is that most investors who bought when the stock came at the end of its rise start selling (heavily). It is mostly ‘weak hands’ that buy near a point. This selling takes place until the stock reaches a point where only ‘strong hands’ entered long positions. Needless to say, ‘strong hands’ know what and why they are buying, so even if their position goes in red they continue to hold … as opposed to ‘weak hands’ who start panicking if their holdings go in red.
Once all selling is done, the stock start rising and, soon after, challenges previous highs, resulting in a breakout and another acceleration of the upward move.
Case in point: Acadia Healthcare, a multinational behavioral healthcare provider operating a network of over 570 facilities with over 17,000 beds across the United States, UK and Puerto Rico.
The weekly chart of Acadia Healthcare shows that it had a quick plunge after IPO in Oct 2011. Even since recovering from the little price glitch, stock price of Acadia has been consistently increasing up to July 2015 when it hits a saturation point.
Since then, price has been consolidating into what is called a ‘falling channel’ for almost 3 years. Do you recognize our ‘strong hands’ vs ‘weak hands’ explanation in this chart setup?
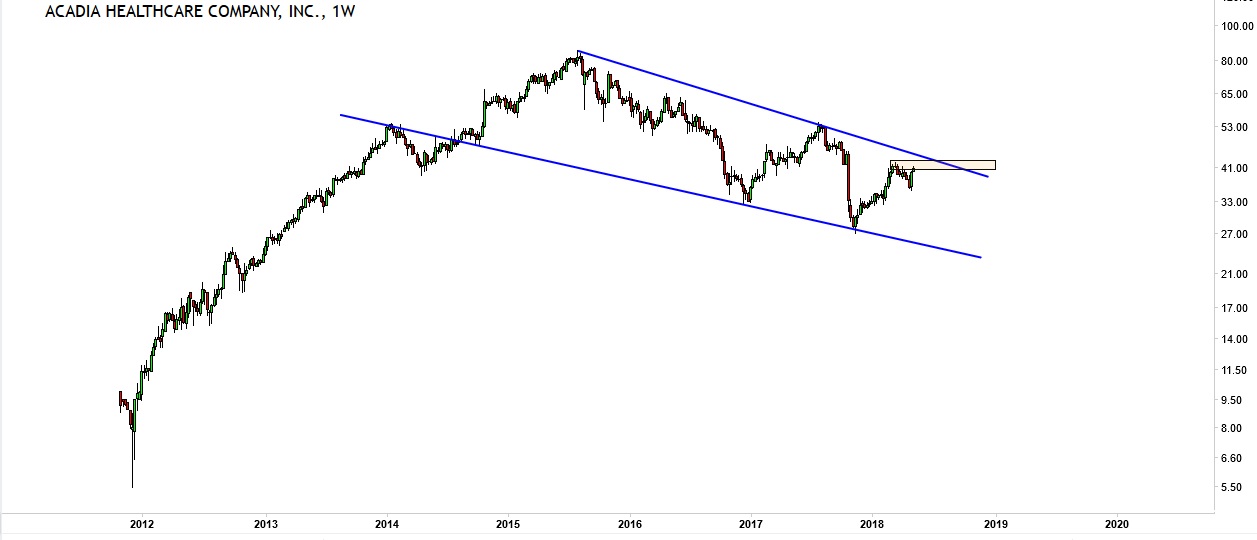
Note that Acadia has a resistance zone in the 40.5 – 43 area, which, if it holds, will be the key for a future bullish shift. This downtrend line has been exerting its selling force and price is set to challenge it again.
If the price is able to break this resistance to the upside chances are high that a 3 year long fall / consolidation will be over. In that case the next upside target will be ~54 followed by ~64 and previous resistance of around 83.
Never forget about a bearish scenario, or, at least, a continuation of a bearish scenario before the trend becomes bullish. If its price fails to break out, and reverses, we would think Acadia needs more consolidation. The first immediate support lies around 35.2, should this fail, price could re-test previous bottom of 27.55. Breaking below the lower wedge line will result in a full fledge bearish outlook.
None of the stocks in this article are buy or sell alerts, they serve as cases to illustrate important setups.


