
The 100-year gold price chart offers many valuable insights. If anything, historical gold charts make the point that gold is a store of value and provides protection against growing government debt.
RELATED – Gold Price Prediction 2025 till 2030
Many charts in this article qualify as must-see charts:
- Historical gold price charts.
- Long term gold price and government debt correlation.
- Gold excluding CPI.
We start with gold’s fundamental picture, and pivot to its monetary attributes.
The value of the 100-year gold price chart
The 100-year gold price trend has been directionally higher over the decades. The gold price matters to people, including both investors and consumers, for the following reasons:
- Wealth preservation: Gold has historically served as a store of value and a hedge against inflation. The upward trend in gold prices over the past century indicates its ability to preserve wealth over time, making it attractive for individuals looking to protect their savings from the erosion of purchasing power.
- Economic stability: The long-term trend of rising gold prices reflects periods of economic uncertainty and volatility. For consumers, it prompts them to consider diversifying their investments.
- Investment opportunity: Gold as a long term investment asset is justified due to its historical value appreciation. Gold tends to attract investors seeking long-term growth and portfolio diversification.
- Global financial stability: Gold prices are influenced by various macroeconomic factors, including geopolitical tensions, monetary policy decisions, and currency fluctuations. The upward trend in gold prices reflects persistent concerns about global financial stability, over the years and decades.
Overall, it is clear from these points that the historical gold price trend holds significance for investors and society.
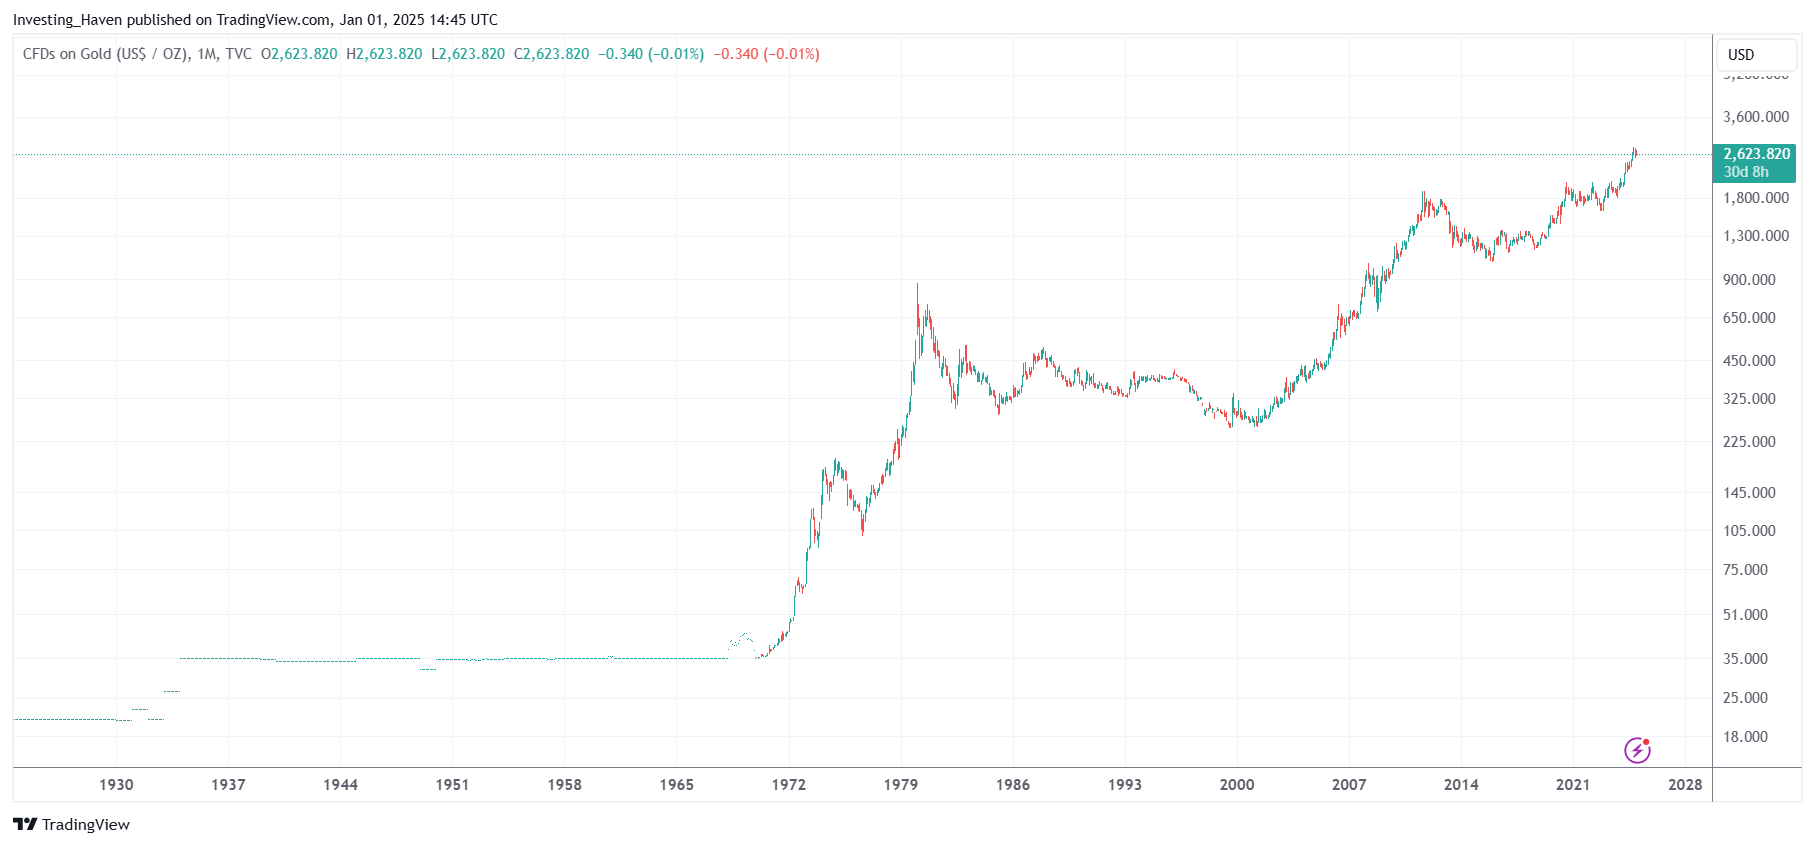
The 100-year gold price chart
The 100-year gold price chart is an absolute beauty.
The true meaning of this historical price chart can only be understood when thinking in secular terms, combining fundamentals and intrinsic value.
There are 3 insights to derive from this historical gold price chart:
- The long term direction is consistently higher, despite some pullbacks along the way.
- There have been quite some periods in history in which the price of gold accelerated its upward move.
- The gold price rise was phenomenal in the 70ies because of inflation. Gold rose strongly in the period 2001-2011. The uptrend is slowing down, in relative terms.
The three acceleration phases (bull market) are very visible on the candlestick version of the 100-year gold price chart (quarterly candles).
READ – Detailed historic gold price trends in our 50-year gold chart analysis.
January 1st – Gold in 2025 is expected to continue its uptrend. After a steep rise in 2024, the new year may start slowly. However, there is not any sign that the gold bull market is over when looking at gold’s 100-year price chart.
An even longer historical gold price chart is the one below: the gold price chart over 300 years. This is the longest historical gold price wit some relevance at present day (read: in our modern economic and monetary system). The same conclusions apply as the ones derived from the 100-year gold chart.
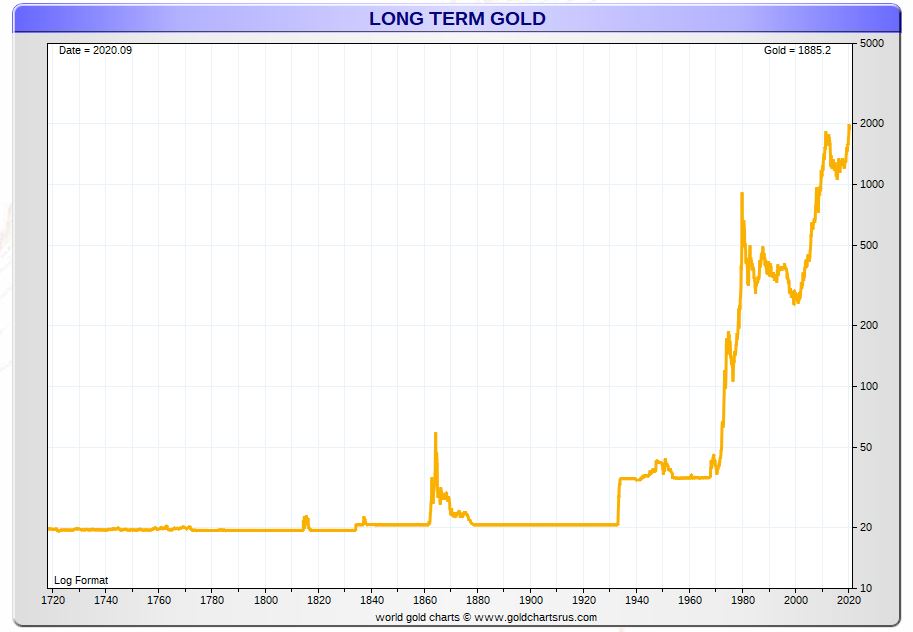
There is no reason to believe that gold will not be able to move higher from here.
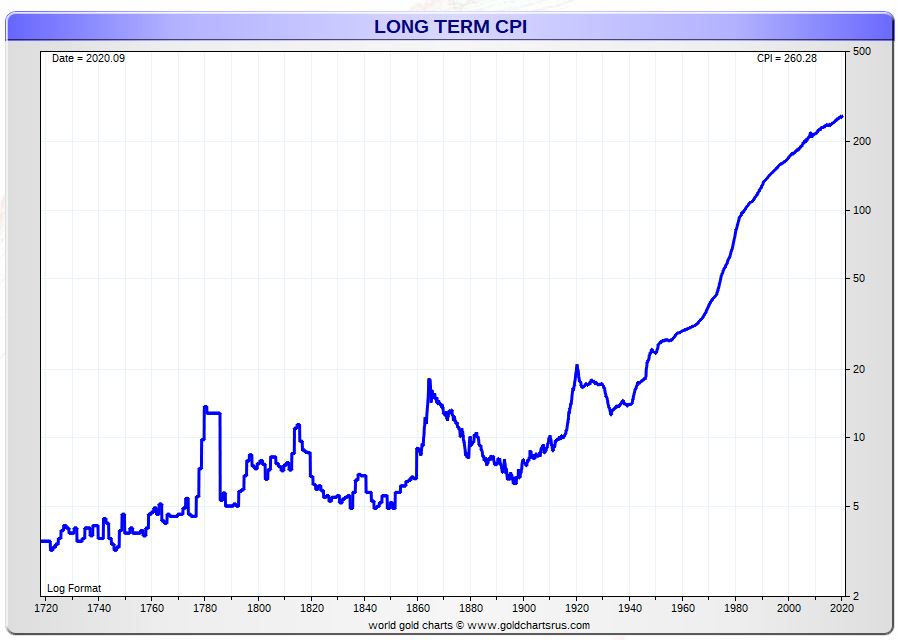
Historical gold price trend vs. CPI trend
One of the most relevant correlations, when thinking about the historical gold price trend, is with CPI (consumer price index).
Essentially, what this correlation says is that the price of gold tends to move higher along with rising inflation.
The historical CPI chart, in log format, is shown below. Note how the CPI was kept low, in a specific range, prior to the Gold Reserve Act. Also, note how the CPI started an exponential rise since Nixon unilaterally decided to decouple gold from the U.S. Dollar world reserve system.
Considering inflation and adjusting the gold price according to the Consumer Price Index (CPI) reveals gold’s role as a safeguard for wealth and purchasing power.
Unlike the nominal gold price, which can fluctuate significantly, the CPI-adjusted gold price shows a different pattern.
It appears relatively stable and remains within a consistent range, rather than exhibiting strong trends. This stability is indicative of effective capital preservation and wealth protection.
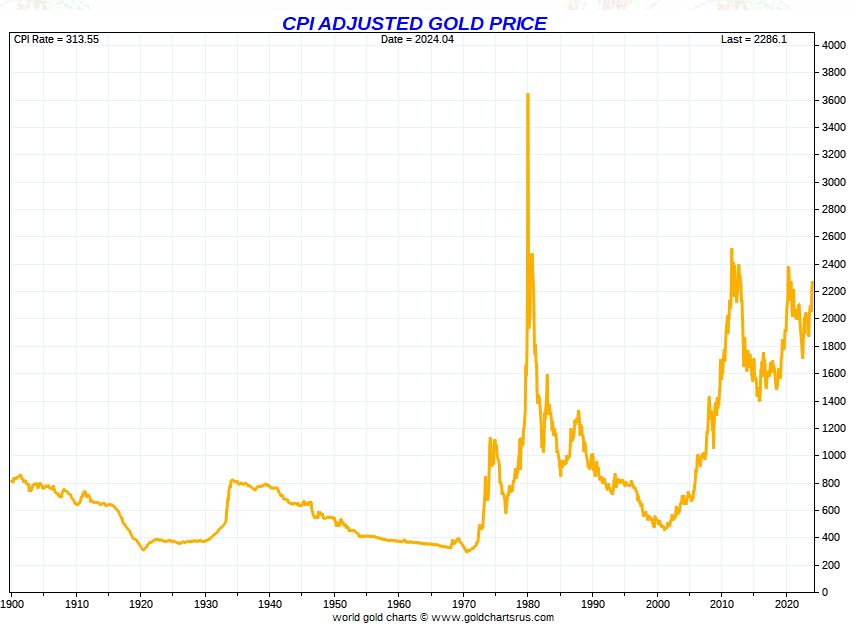
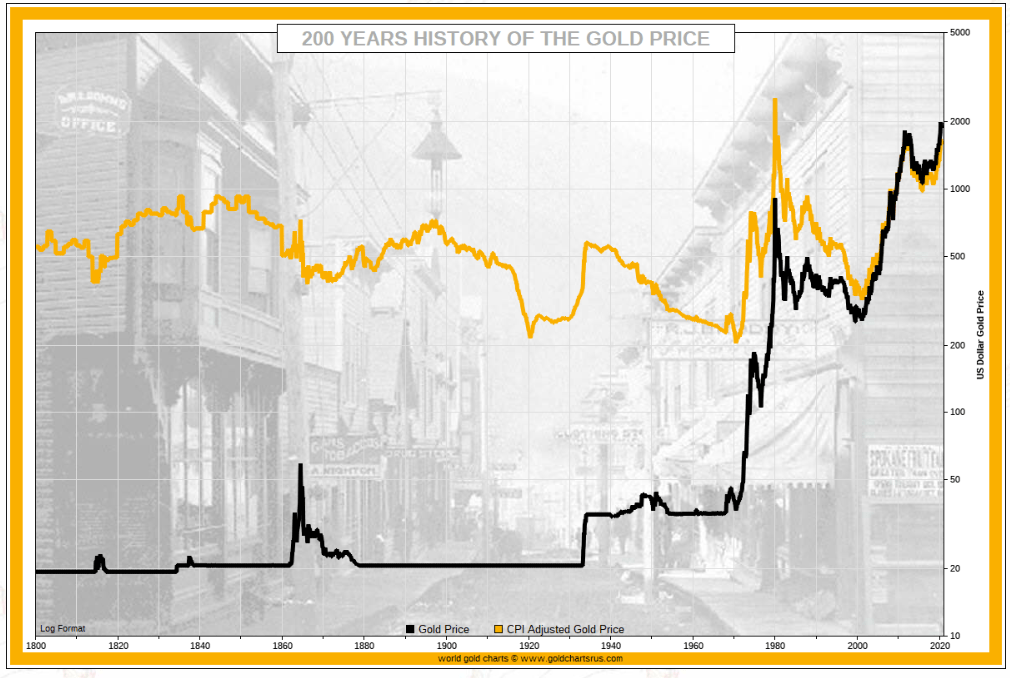
Historical gold price chart adjusted for CPI
Further to the correlation between gold and the CPI, we find value in the 200-year gold price chart.
The key take-aways from this gold price adjusted historical chart:
- The gold price (black line) shows a very strong uptrend.
- The CPI adjusted gold price (yellow line) is rather stable, even over a period of 200 years.
This, once again, makes the point that gold preserves purchasing power.
Must-See: Historical gold price vs. U.S. debt
The relationship between the historical gold price and U.S. debt from 1970 to 2023 is explored in the graphic shown below, using data from In Gold We Trust and the Federal Reserve Bank of St. Louis. Over this period, gold has been viewed as a store of value and a hedge against economic uncertainty, with its price closely linked to concerns about the growing U.S. national debt.
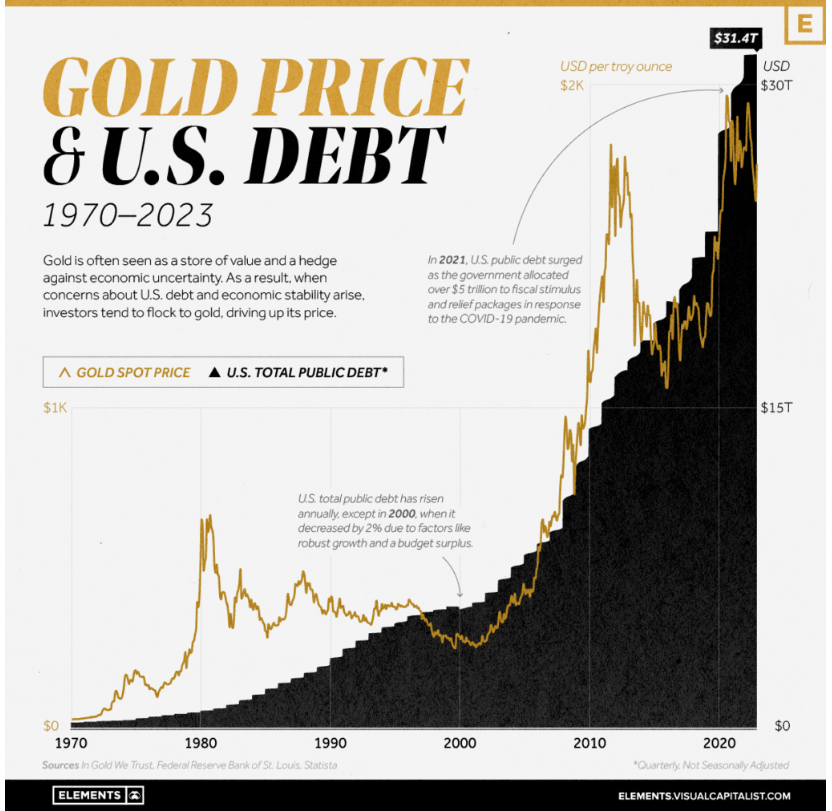
Source – In Gold We Trust
The U.S. national debt has steadily increased since 1970, reaching an all-time high of $31.4 trillion in 2023. This growth has sparked debates in Congress about raising the debt ceiling to avoid potential defaults. Additionally, when factoring in federal unfunded liabilities, the fiscal imbalance exceeds $244.8 trillion, nearly 10 times the current U.S. GDP.
Rising U.S. debt often leads to concerns about inflation, prompting investors to turn to gold as a hedge. Furthermore, as debt levels rise, investors may seek safe-haven assets like gold amid concerns about financial market stability.
Many central banks, especially those in the BRICS countries, know very well that global debt is spiraling out of control. There is a reason why they are hoarding physical gold.
Since 1971, no paper currency has been pegged to gold, except for the Swiss franc, which severed its gold linkage in 2000.
Today global debt is over $300 trillion.
Today, the gold price in China is trading at a RECORD premium compared to international prices.
Second largest… pic.twitter.com/mwAuD1kNve
— Gold Telegraph Sept 17, 2023
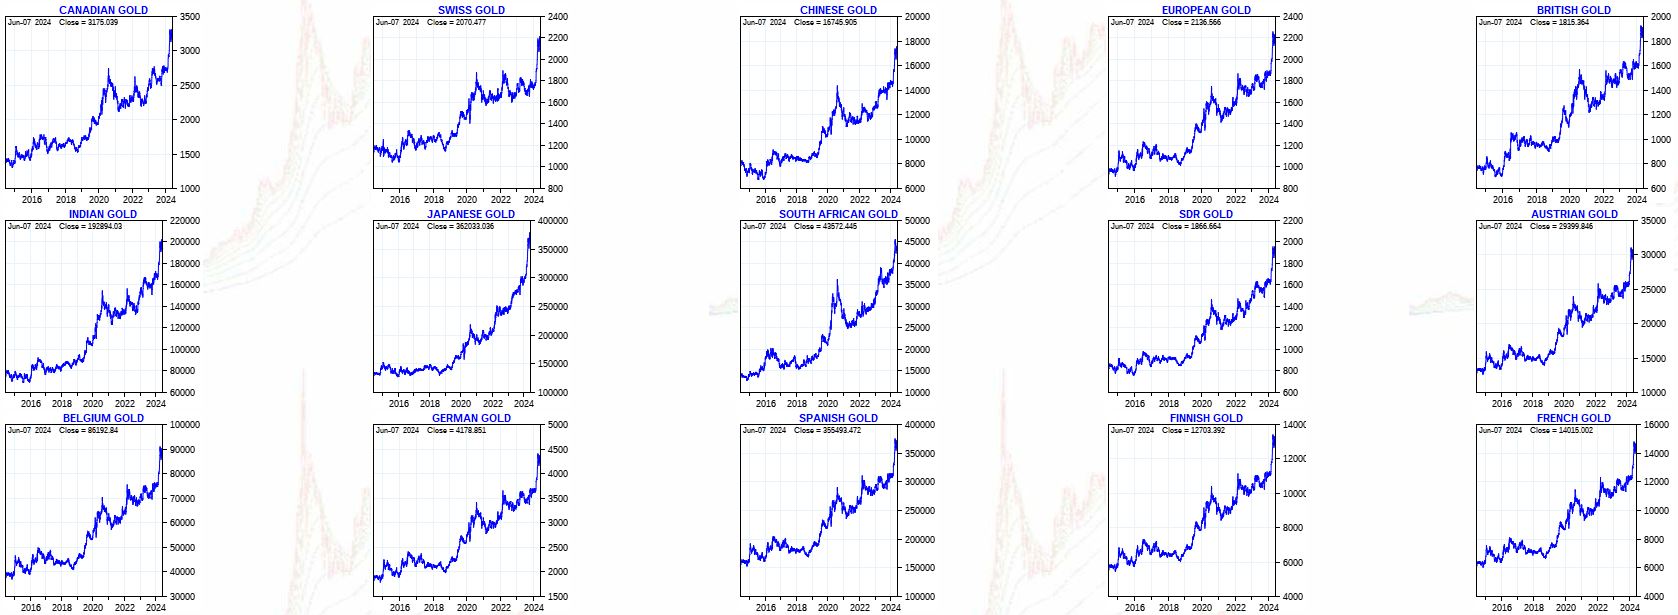
Gold prices in multiple global currencies
While the historical gold price chart comes with wise lessons, we also don’t want to lose sight of the price of gold in global currencies other than the U.S. Dollar.
A recent remember of this:
London’s gold price benchmark has hit a new record high.
Things are getting hot.
— Gold Telegraph December 27, 2023
Below is an overview of gold prices in world currencies. While not 100-year gold price charts (‘only’ 10 years of gold price trends), this overview has a very clear message: gold is in a secular bull market.
Gold price on 100 years: conclusions
We explored the significance of the 100-year gold price and its relevance for investors and consumers.
The article includes insights from the 100-year gold price chart:
- Gold’s upward direction and periods of accelerated growth.
- Correlations between gold prices and factors such as the Consumer Price Index (CPI) and U.S. national debt.
- Gold’s role as a preservation of wealth and purchasing power.
Overall, the enduring significance of the 100-year gold price trend and its implications for investors and society cannot be emphasized enough.
Courtesy of Nick Laird from GoldChartsRUs.com for the rock solid historical gold price charts featured in this article.


