Investing Haven
No Result
View All Result
Gold Silver Investing >>
CRYPTO INVESTING >>
  • 2025 Forecasts
    • 10 market predictions
    • Dow Jones forecast
    • S&P 500 forecast 2025
    • Nasdaq prediction 2025
    • Best altcoins to buy
    • Best crypto to buy now
    • Which crypto will explode
    • 15 crypto forecasts 2025
    • Which precious metal to buy
  • Silver
    • Silver prediction 2025 – 2030
    • Will silver exceed $30?
    • When will silver hit $50?
    • Can silver hit $100?
    • Silver shortage
    • 50-year silver chart
    • Silver bullish reversal
    • Silver seasonality charts
    • How to invest in silver
  • Gold
    • Gold prediction 2025 – 2030
    • Will gold set new ATH?
    • Will gold hit $3,000?
    • Can gold hit $10,000?
    • Gold chart 10 years
    • Gold chart 50 years
    • Gold chart 100 years
    • Gold silver ratio
    • Gold seasonality charts
  • Commodities
    • Coffee forecasts
    • Sugar forecasts
    • Nickel forecasts
    • Lithium investing
  • Crypto forecasts
    • BTC prediction 2025 – 2030
    • ETH prediction 2025 – 2030
    • SOL prediction 2025 – 2030
    • XRP prediction 2025 – 2030
    • XLM prediction 2025 – 2030
    • BNB prediction 2025 – 2030
    • ADA prediction 2025 – 2030
    • AVAX prediction 2025 – 2030
    • KAS prediction 2025 – 2030
    • NEAR prediction 2025 – 2030
    • BCH prediction 2025 – 2030
    • LINK prediction 2025 – 2030
    • DOT prediction 2025 – 2030
    • SUI prediction 2025 – 2030
    • ICP prediction 2025 – 2030
    • LTC prediction 2025 – 2026
    • STX prediction 2025 – 2030
    • DOGE prediction 2025 – 2030
    • SHIB prediction 2025 – 2030
    • PEPE prediction 2025 – 2030
    • FLOKI prediction 2025 – 2030
    • WIF prediction 2025 – 2030
    • ONDO prediction 2025 – 2030
  • News
    • Crypto news
    • Commodities
  • Login
Investing Haven
No Result
View All Result

Home » Commodities & Gold » 3 Gold Market Leading Indicators For Gold Investors In 2023 & 2024

3 Gold Market Leading Indicators For Gold Investors In 2023 & 2024

Discover essential insights for gold investors in 2023 & 2024 with these gold market leading indicators: gold's chart pattern, CoT report, and Gold-Treasuries ratio.

Taki T. by Taki T.
November 28, 2023
in Commodities & Gold
gold forecast
1.9k
VIEWS
Share on FacebookShare on Twitter

Understanding the gold price direction requires an understanding of the factors influencing the gold market, i.e. gold market leading indicators. We published some in-depth gold market reports in the past, first and foremost our gold forecast and arguments why gold is set to rise over the long term. For investors eyeing the yellow metal in 2023 and 2024, the critical question is: what are the key indicators that can provide insights into gold’s potential movements? In this comprehensive guide, we delve into three indicators that can guide gold investors, presented in a way that investors can track those leading indicators as a ‘self service tool set.’

We start with the dominant pattern on the gold chart, continue with gold’s bullish CoT report and look at a really bullish Gold-Treasuries ratio:

  • Gold market leading indicator #1: The gold chart pattern.
  • Gold market leading indicator #2: Gold CoT report.
  • Gold market leading indicator #3: Gold priced in treasuries.
  • Conclusion: Indicators for gold investors in 2023 & 2024.

Gold market leading indicator 1: The gold chart pattern

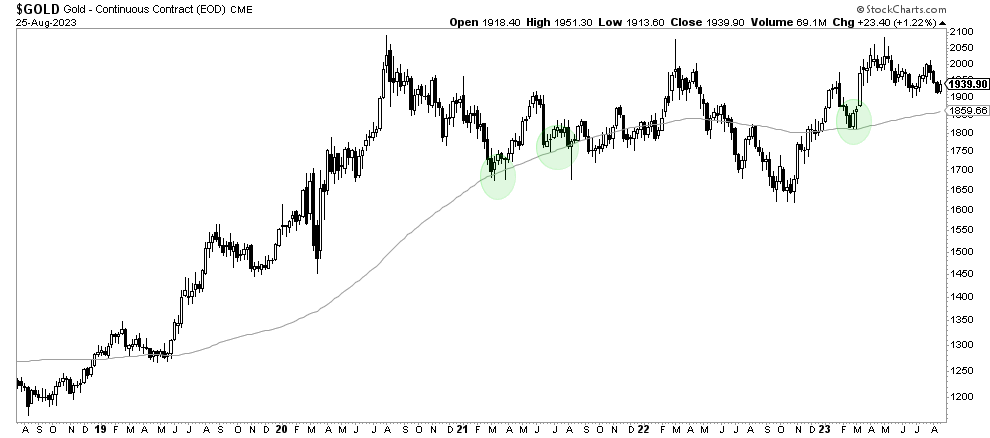
The first and most fundamental indicator in the world of gold investment is, unsurprisingly, the gold price chart. A visual representation of historical price movements, the gold chart provides a roadmap for understanding the dominant trend.

One would argue that the gold chart is not a gold leading indicator. We thoroughly disagree. Decisions from all market participants are represented on the chart, any chart, so the chart of gold in and on itself is one of the key gold market leading indicators.

While we have a few reliable charts that show the dominant long term pattern, we believe the weekly chart on 5 years says it all. Gold’s historical price movements tend to take the shape of a series of reversals, either bullish or bearish. Over the last 5 years, gold’s chart exhibits a tripe W-reversal. Equally important, the one and only moving average that we track, the 90-week moving average (WMA), has a rising slope now. Gold did not touch its 90 WMA since March of 2023. We see a pressure cooker on this chart, with sufficient evidence that gold can rise to new ATH either in 2023, but presumably more likely in the first part of 2024.

gold market leading indicator gold chart

Gold market leading indicator 2: Gold CoT report

The Commitment of Traders (CoT) report is a powerful tool for understanding market sentiment and positioning. It provides insights into the positions of different trader categories, including commercials and non-commercials, offering a snapshot of how market participants are positioned in the gold market.

The gold CoT report is especially useful for detecting potential price reversals, whenever net positions reach extremes. That’s why we think of gold’s CoT report as a ‘stretch indicator’, it is a gold market leading indicator but one that is very reliable when extreme readings are reached.

When commercial traders, often considered the “smart money,” reach unusually low net short positions, it always signals an impending price rise. The opposite is true as well.

As seen, gold’s CoT report is close to reaching extreme levels: net short positions of commercials are close to hitting multi-year lows. Similar readings were reached last October, after which a multi-month 20% rally started.

gold market leading indicator CoT

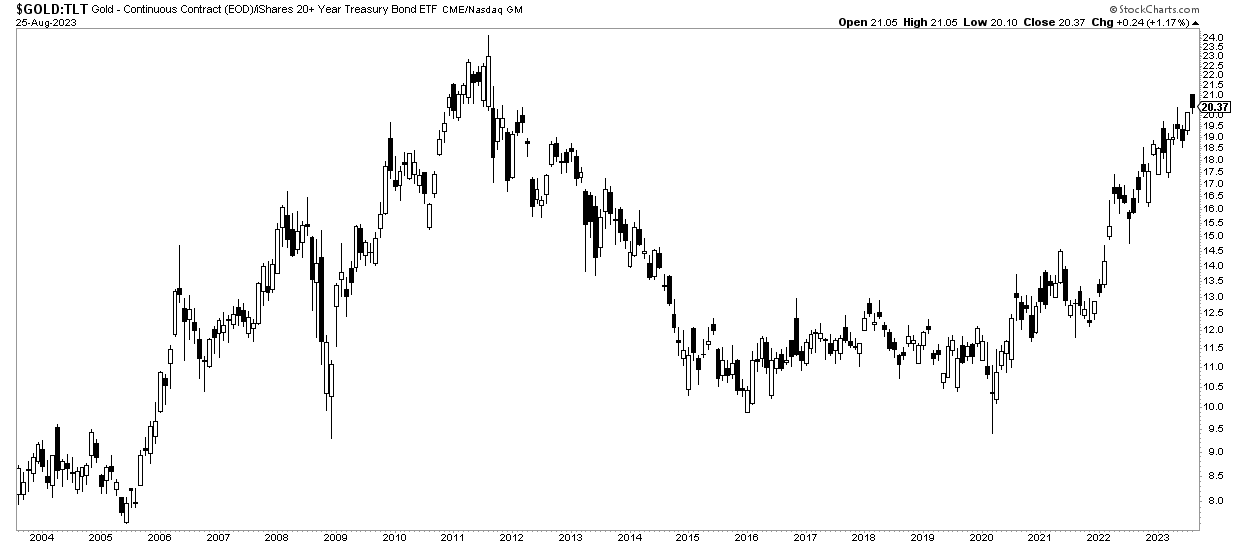
Gold market leading indicator 3: Gold priced in treasuries

The relationship between gold and government bonds, particularly US Treasuries, is a nuanced yet insightful gold market leading indicator. Gold’s price often reacts to changes in bond yields, reflecting the broader market sentiment towards risk and inflation. When Treasury yields rise, the opportunity cost of holding non-yielding gold increases, potentially leading to a decline in its price. On the other hand, declining yields can boost gold’s appeal as a safe-haven asset.

The ratio between the gold price and the yield on Treasury bonds, often referred to as the “real yield,” can offer deeper insights. A negative real yield, which occurs when the yield on Treasuries is lower than inflation, tends to be bullish for gold. In this scenario, investors flock to gold as a hedge against eroding purchasing power.

What we like a lot about the Gold-Treasuries ratio is the bullish rounded reversal. This is set to continue to rise, in our view, taking out the 2011 highs of the ratio. This pattern is so powerful.

gold market leading indicator gold-treasuries

Conclusion: Indicators for gold investors in 2023 & 2024

The world of gold investment is driven by a multitude of factors. As investors consider their investing strategies for 2023 and 2024, these 3 leading indicators serve as valuable tools: the gold chart pattern (featuring the series of reversals and also the 90 WMA), the CoT report (featuring extreme net short positions of commercials), and the relationship between Gold-Treasuries. All three of them give us bullish readings, leading to a comfortably bullish stance for the price of gold in 2023 & 2024.

We continue to believe that gold should be looked at as a long term investment, not a short to medium term oriented trade!

In our Momentum Investing service, we feature every weekend more detailed gold & silver analysis than what we offer in the public domain. We also offer a selection of top & silver stocks for our premium members.

10-YEAR ANNIVERSARY OFFER: InvestingHaven.com celebrates 10 years. Temporarily, you can enjoy a discount on our premium gold/silver and crypto reports. Or you can become a VIP member. Go to our anniversary deals >>
Receive our weekly newsletter.

premium service SP-500 premium service trade alerts premium service crypto teaser 

No related posts.

Tags: 2023 Forecasts2024 ForecastsGOLD
Taki T.

Taki T.

Taki is a chart analyst who is passionate about unlocking unique insights out the chart. While the vast majority of analysts remain focused on price analysis, Taki starts with timeline analysis and adds price analysis to this. In doing so, he developed a unique methodology to find opportunities in financial markets, across assets and markets.

Connect with InvestingHaven

Receive top notch forecasts for free.

*We hate spam as you do.

Site Navigation

  • RSS Feed
  • About us
  • Advertising
  • Sponsored Content Policy
  • Mission 2026
  • Sitemap
  • Privacy & Disclaimer
  • Terms of Service
  • Contact Us
investing haven logo

Precious metals market analysis including gold and silver price predictions. Crypto market analysis including highly accurate BTC ETH SOL XRP forecasts.

Copyright © 2025 InvestingHaven

Login to your account below

Forgotten Password?

Fill the forms bellow to register

All fields are required. Log In

Retrieve your password

Please enter your username or email address to reset your password.

Log In

Receive top notch forecasts for free.

*We hate spam as you do.

No Result
View All Result
  • News
  • 2025 Forecasts
    • 10 market predictions
    • Dow Jones forecast 2025
    • S&P 500 forecast 2025
    • Nasdaq prediction 2025
    • Best crypto to buy now
    • Which crypto will explode
    • Best altcoins to buy
    • 15 crypto forecasts 2025
    • Which precious metal to buy
  • Silver articles
    • Silver prediction 2025 – 2030
    • Will silver exceed $30?
    • When will silver hit $50?
    • Can silver hit $100?
    • Silver shortage
    • 50-year silver chart
    • Silver bullish reversal
    • Silver seasonality charts
    • How to invest in silver
  • Gold
    • Gold prediction 2025 – 2030
    • Will gold set new ATH?
    • Will gold hit $3,000?
    • Can gold hit $10,000?
    • Gold chart 10 years
    • Gold chart 50 years
    • Gold chart 100 years
    • Gold silver ratio
    • Gold seasonality charts
  • Commodities
    • Sugar forecasts
    • Coffee forecasts
    • Nickel forecasts
    • Lithium investing
  • Crypto news
  • Crypto forecasts
    • BTC prediction 2025 – 2030
    • ETH prediction 2025 – 2030
    • SOL prediction 2025 – 2030
    • XRP prediction 2025 – 2030
    • XLM prediction 2025 – 2030
    • BNB prediction 2025 – 2030
    • ADA prediction 2025 – 2030
    • AVAX prediction 2025 – 2030
    • KAS prediction 2025 – 2030
    • NEAR prediction 2025 – 2030
    • BCH prediction 2025 – 2030
    • LINK prediction 2025 – 2030
    • DOT prediction 2025 – 2030
    • SUI prediction 2025 – 2030
    • ICP prediction 2025 – 2030
    • LTC prediction 2025 – 2026
    • STX prediction 2025 – 2030
    • DOGE prediction 2025 – 2030
    • SHIB prediction 2025 – 2030
    • PEPE prediction 2025 – 2030
    • FLOKI prediction 2025 – 2030
    • WIF prediction 2025 – 2030
    • ONDO prediction 2025 – 2030
  • Premium Crypto Alerts
  • Premium services

Copyright © 2025 InvestingHaven