The price of gold has been acting somehow ‘weird’ in recent weeks. Some nice bullish price action immediately followed by some big red candles. Even though our gold price forecast for 2020 is almost met at the time of writing we want to understand how much more upside there is in the gold market, as well as in the silver market (as per our silver forecast).
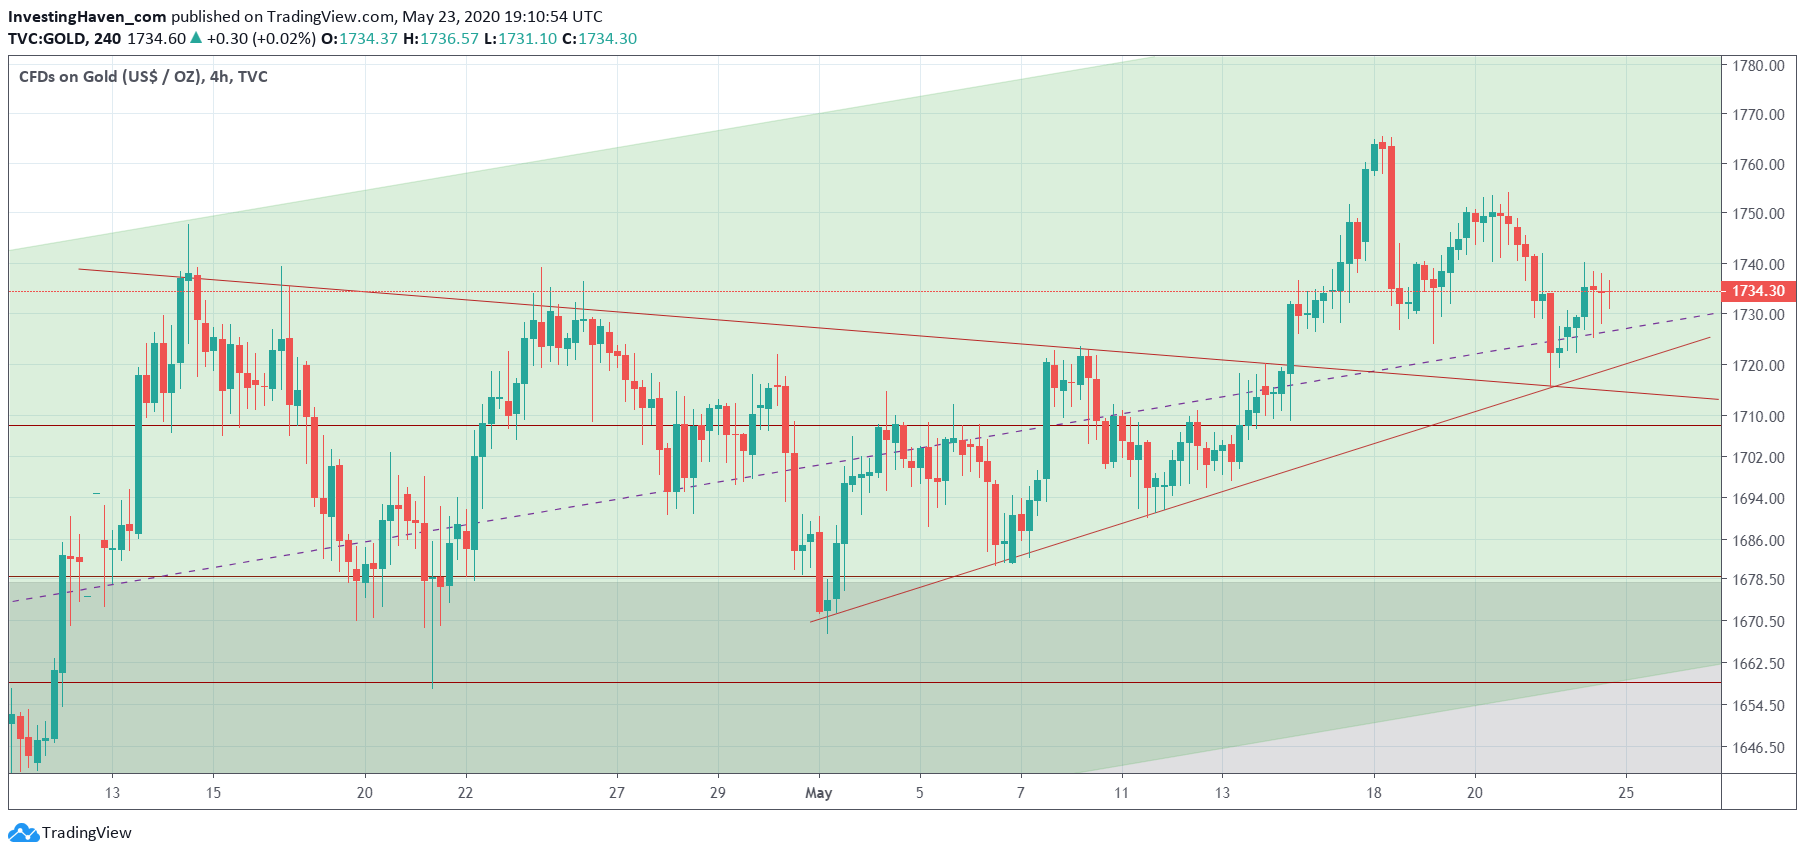
In this article we include one of the many charts our premium members receive this weekend. It’s the gold price chart, intraday, on 1.5 month.
There are 2 things that come to mind when we look at this close up of the gold chart, enriched with our annotations.
First, a breakout that took place on Thu May 14th.
Second, a backtest of the breakout, exactly the crossroad of 2 trendlines, which took place on Thu May 21st.
Interestingly, gold’s price now trades exactly at former highs, but is hiding what it wants to do next.
Gold is mostly very decisive in its trend. Right now, one way or another, it is ‘reluctant’ to move decisively. Moreover, it is not revealing clear signs in its chart pattern what comes next.
Myserious gold market.
In our premium investing service we did exit a GDX ETF position earlier this week with a profit of 22.3% in 5 weeks. Moreover, we took a position on a top silver miner and realized a profit of 15.9% in a few days (combined with another very short term GDX position). The 15.9% profit made up for a loss in an oil tanker stock, and we showed members how to ‘win back’ a losing position. This ‘win back’ approach is something we have never seen any other premium service show to its members even though it is the one and only common problem that every investor is facing in its investing career: correctly handle a losing position, and turn it into break even in one week.


