Crude oil was the most important mover of this week. On Thursday 04/02 crude oil registered its largest single-day percentage gain in history (24% ) … on a tweet by Donald Trump. Pretty impressive, how a 280 character message on social media can lead to the highest single day gain in crude oil’s history. However, we have to remove short term speculation from the equation, and focus on the chart to understand trends, direction, trend changes.
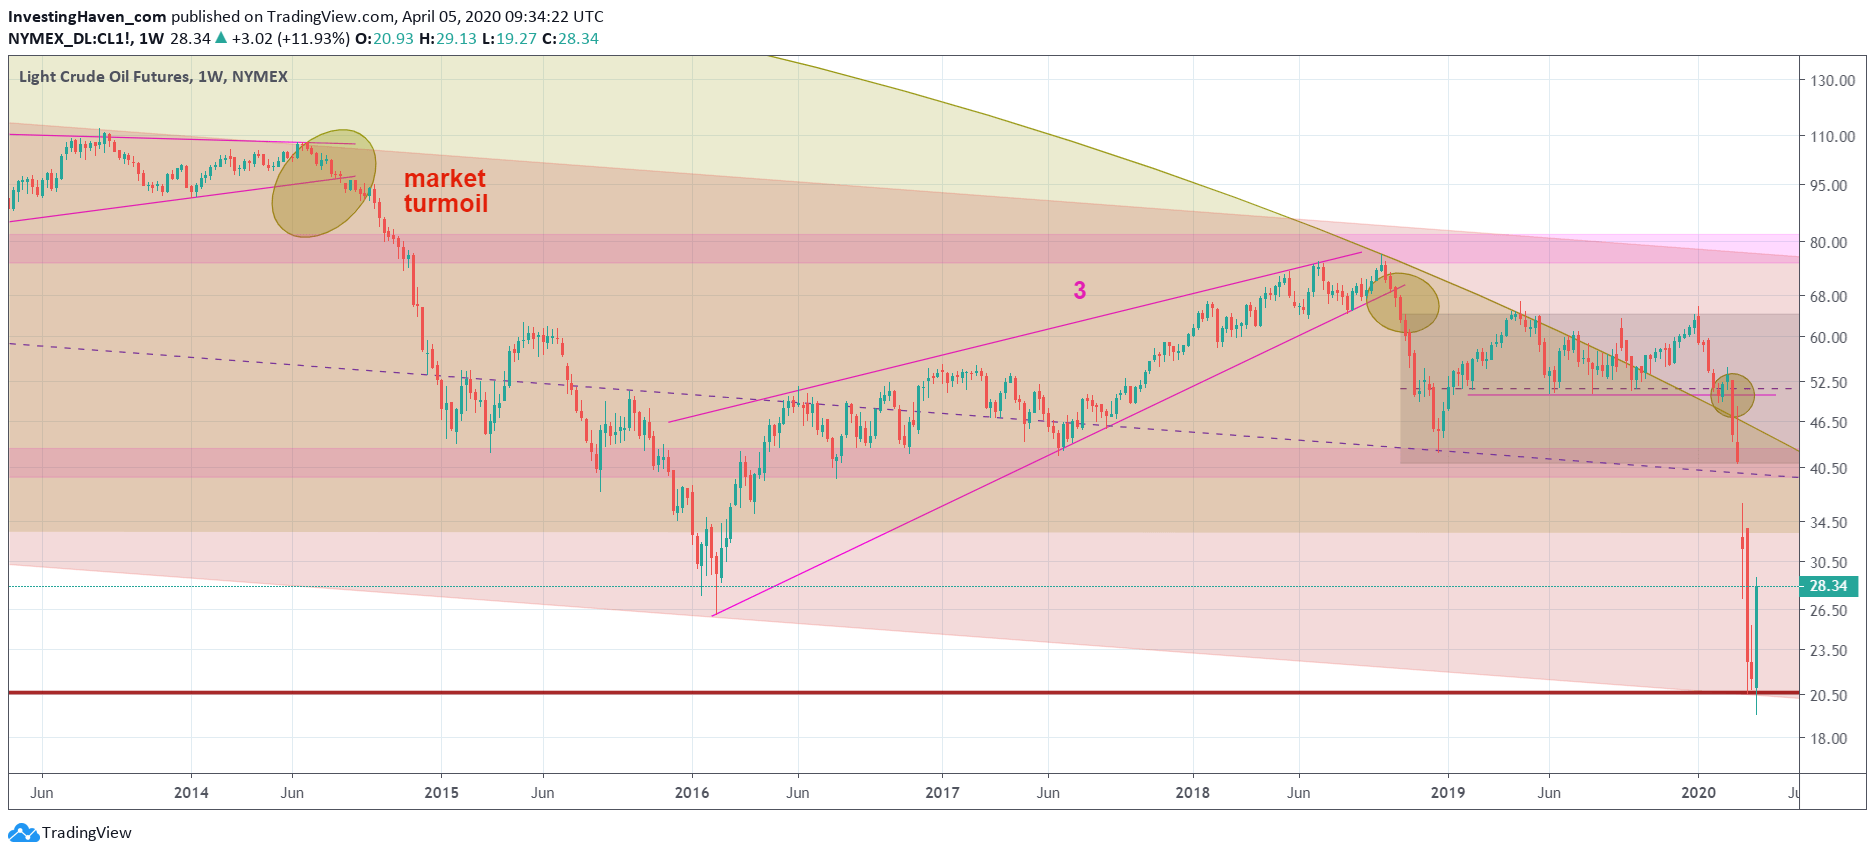
The weekly crude oil chart is featured in this article. It helps us break through the clutter, in order to see trends, direction, trend changes.
Crude oil has one of the most complex charts primarily because its chart has a multi-pattern setup. In other words we have to be able to identify multiple patterns concurrently in order to understand this chart.
It’s the reason why we have so many colors on below chart: they all represent different trends and patterns.
The scope of this article is not to dissect crude’s chart. It is to understand ongoing price action.
If anything it was to be expected that crude could bounce from current levels, especially because it hit support going back to 2002 and the 90ies.
Right now, after an historic rise on Thursday and Friday, crude is hitting the 2016 lows. Remember, the 2015 crude oil crisis was one of the toughest in its history. However, according to industry experts and recent research, the current over supply in the oil market is even worse than the one in 2015 and 2008.
Even with the OPEC intervention (production cuts) which is to be expected in the next few days and weeks can we reasonably expect crude oil to move structurally higher from here?
Crude has to clear an important level: 29-30 USD per barrel. Even then it will hit 33-34 USD, another crucial level. If anything the setup on this chart looks very weak at best, arguably even disastrous.


